
Figure 1.
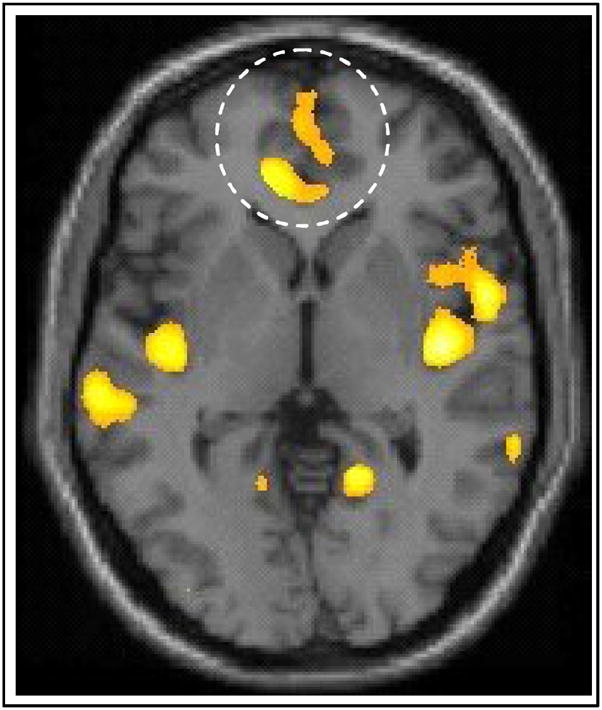
The inset on the axial slice depicts reductions in BPD subjects in ventral cingulate gyrus (Cluster peak: t59 =3.48, x=−1, y=61, z=1).
Official websites use .gov
A
.gov website belongs to an official
government organization in the United States.
Secure .gov websites use HTTPS
A lock (
) or https:// means you've safely
connected to the .gov website. Share sensitive
information only on official, secure websites.
The inset on the axial slice depicts reductions in BPD subjects in ventral cingulate gyrus (Cluster peak: t59 =3.48, x=−1, y=61, z=1).