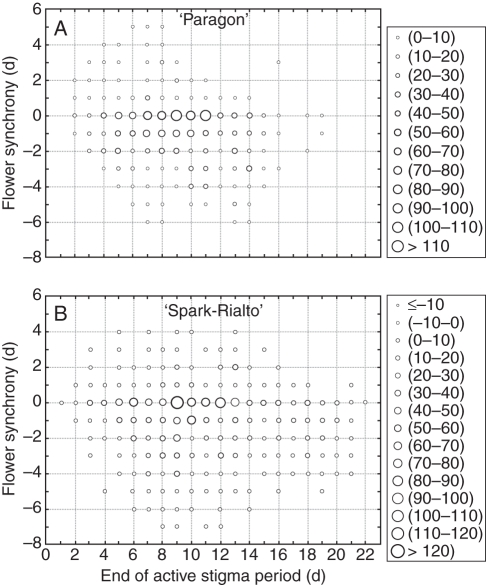
Fig. 1.
Frequency scatterplots of flowering synchrony calculated as the day of pollen dehiscence minus day of stigma collapse for ‘Paragon’ (A) and ‘Spark-Rialto’ lines (B). Negative synchrony values imply dehiscence before stigma collapse; zero on x-axis indicates the first day of flowering in a plant (n = 11 for ‘Paragon’ and n = 32 for ‘Spark-Rialto’).

