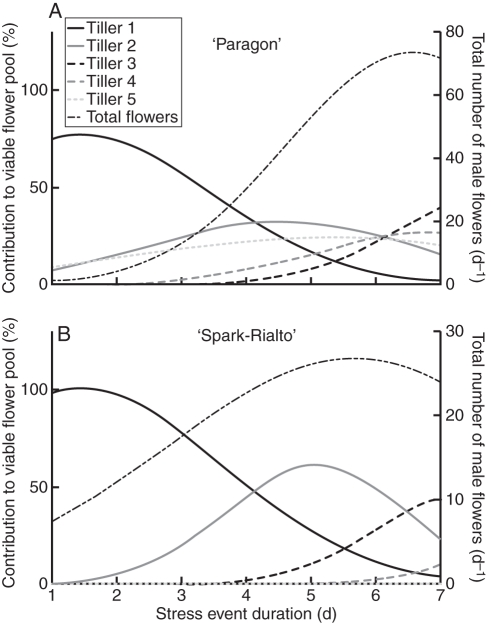
Fig. 5.
Relative contribution of surviving male flowers on each tiller to the total number of surviving flowers on a plant (left axis) and the total number of active male flowers per day (right axis), while the x-axis represents the duration of a hypothetical heat-stress event. See Supplementary Data Table S2 for model description and parameter estimates.

