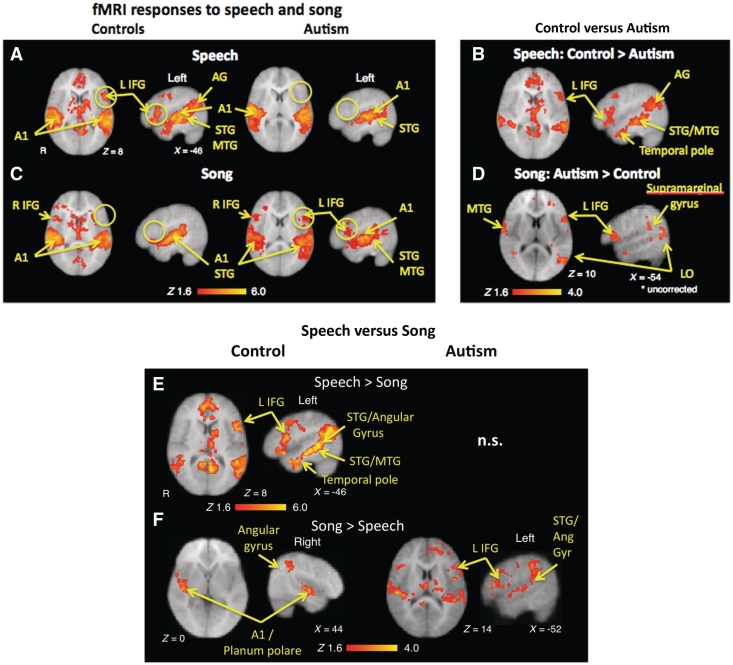
Figure 2.
Functional MRI responses during speech and song stimulation. (A) Speech: control subjects (left) activated A1, temporal regions [superior temporal gyrus (STG); middle temporal gyrus (MTG) and angular gyrus (AG)] and left inferior frontal gyrus (IFG, circles), as well as SMA. Autistic subjects (right) activated A1 and superior temporal gyrus, but not in left inferior frontal gyrus (empty circles), supplementary motor area (SMA) or midline regions. (B) Speech: control < autism contrast confirmed greater activation in regions outside A1 in control subjects. (C) Song: both controls (left) and autistic (right) children activated A1 and right inferior frontal gyrus. Autistic subjects also activated left inferior frontal gyrus (circles). (D) Song: autism > control contrast showed greater activation in left inferior frontal gyrus (uncorrected). (E) Control: speech > song showed greater activity in left inferior frontal gyrus, left temporal regions, and midline structures (F) Control: song < speech contrast showed increased activation in right temporal and parietal regions. Autism: song > speech showed greater activation in bilateral inferior frontal gyrus and temporal regions. L = left; LO = lateral occipital cortex; n.s = not significant; R = right.

