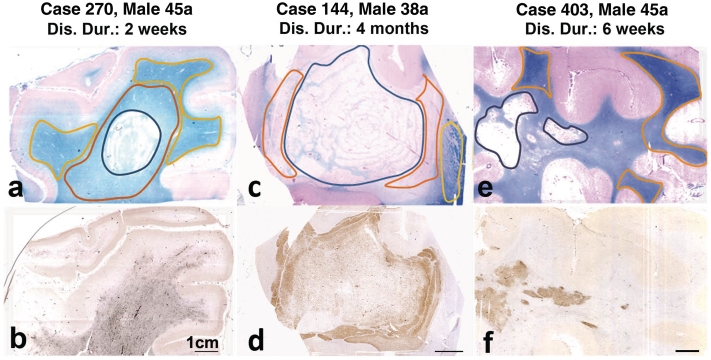
Figure 1.
Acute multiple sclerosis lesions used for gene expression analysis; the structure of the lesions is shown in sections stained with Luxol fast blue (myelin; a, c and e); the lower panel of figures shows the same lesions, stained for p22phox expression in activated macrophages and microglia. In the first patient (a and b), the active lesion (black outline) is surrounded by a broad area of microglia activation with p22phox expression and myelin pallor (red outline; initial lesion), which makes it difficult to see the lesion margin in the staining for macrophages and microglia. In the normal-appearing white matter (yellow outline), myelin density is normal, but there is still moderate microglia activation. In the second patient (c and d), the demyelinated lesion core (black outline) shows concentric rings of preserved myelin. This is surrounded by the initial lesion area with extensive immunoreactivity for p22phox (red outline). The normal-appearing white matter shows normal myelin density and low expression of macrophage antigens (yellow outline). In the third patient (e and f) a dense infiltrate of macrophages with p22phox expression is seen in the area of demyelination (active plaque). In the surrounding white matter, there is little expression of macrophage/microglia antigens. Areas of normal white matter used for gene expression analysis are shown by the yellow outline. Gene expression for proteins involved in oxidative damage and for mitochondrial proteins has been analysed separately in the indicated lesion areas. Dis. Dur = disease duration.

