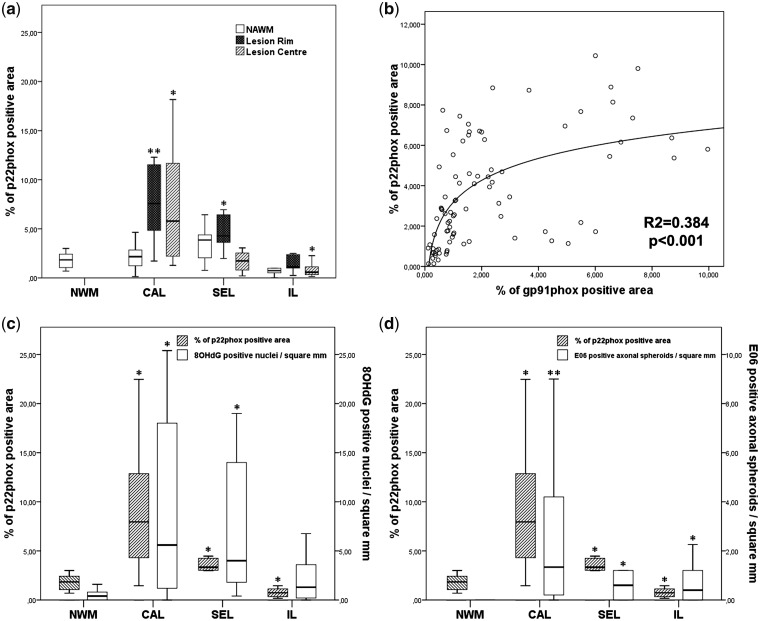
Figure 3.
(a) Quantitative analysis of p22phox expression in different types of multiple sclerosis lesions. Compared with control white matter, there is a significantly higher expression (P < 0.01) in classical active (CAL) and slowly expanding multiple sclerosis lesions (SEL), and in the normal-appearing white matter (NWM) of slowly expanding lesions; in the lesions p22phox-positive microglia are mainly seen in the active lesion edge (initial lesions, IL) and less in the inactive lesion centre. Furthermore, we found a significant decrease of p22 expressing microglia in the centre of inactive lesions. (b) Correlation between p22 and gp91 expression in different multiple sclerosis cases and lesions. The same areas of normal-appearing white matter and lesions were scanned for p22phox and gp91phox expression and regression was analysed as described in the ‘Material and methods’ section. (c) Comparison between p22phox expression, determined by densitometry and the number of nuclei with oxidized DNA (8OHdG immunoreactivity) within multiple sclerosis lesions. (d) Comparison between p22phox expression and the number of dystrophic axons, immunoreactive for oxidized phospholipids (E06); p22phox and gp91phox immunoreactivity was determined by densitometry; nuclei with oxidized DNA and dystrophic axons, positive for E06 were counted manually (Haider et al., 2011). *P<0.05; **P<0.01.

