Figure 2.
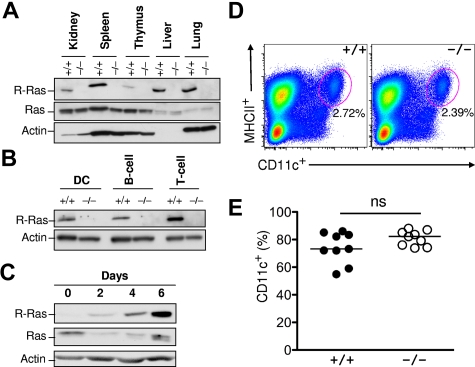
R-Ras expression in immune cells. (A) WT (+/+) and R-Ras knockout (−/−) organs were isolated, and total cell extracts were subjected to Western blotting analysis with the indicated antibodies. (B) WT (+/+) and R-Ras knockout (−/−) spleen was dissociated and subjected to cell sorting with DC-, B cell–, and T cell– specific markers. Western blotting analysis was carried out using an R-Ras specific antibody. (C) Bone marrow progenitors from 6- to 8-week-old mice were cultured in the presence of GM-CSF for 6 days. Cells were monitored throughout the DC differentiation process for R-Ras expression by Western blotting. Parallel membranes were probed with an anti–Ras monoclonal antibody (Millipore). Actin was used as a protein loading control. (D) Age-matched spleens from Rras+/+ and Rras−/− mice were harvested and analyzed for the percentage of MHC class II+CD11c+ DCs. (E) Day 6 BM-DC cultures from Rras+/+ (n = 9) and Rras−/− (n = 9) mice were analyzed for the percentage of CD11c+ DCs. ns indicates not significant. Results are representative of 3 independent experiments.

