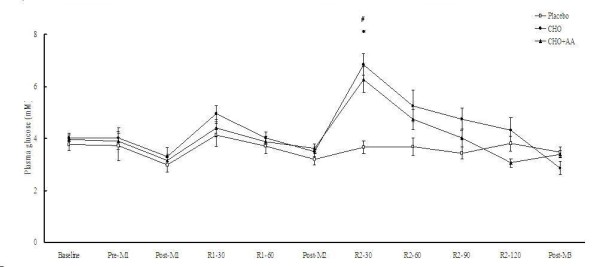
Figure 2.

Plasma glucose concentrations in the 3 trials. Data were analyzed by using repeated measures ANOVA with time and group as factors. Treatment effect p = 0.006; time effect p < 0.001; interaction effect p < 0.001. *CHO trial significantly different from placebo trial at the same time point (p < 0.05). #CHO+AA trial significantly different from placebo trial at the same time point (p < 0.05).
