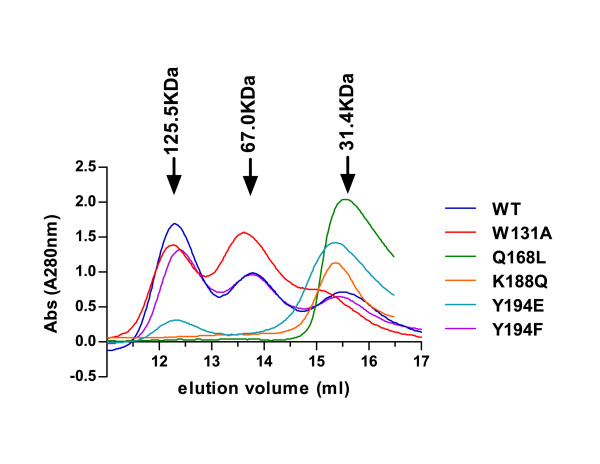
Figure 2.
Oligomerization properties of WT and mutant INs. Size exclusion chromatography (SEC) elution profiles of IN proteins (2.5 μM) versus elution volumes of protein standards (black arrows) are represented. The SEC profile of WT IN (dark blue) shows three peaks corresponding to tetramers, dimers and monomers, respectively. SEC profiles of IN mutants W131A, Q168L, K188Q, Y194E and Y194F are shown in red, green, orange, cyan and purple, respectively.

