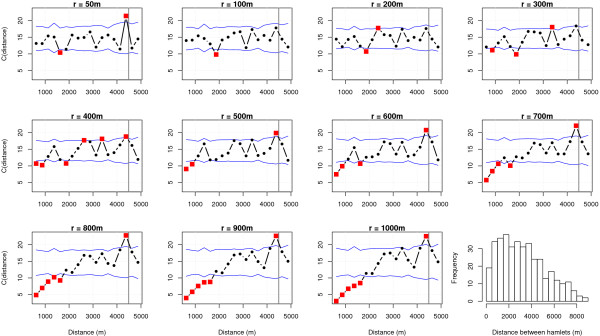
Figure 2.
Multivariate variograms of environmental variables as a function of buffer size. The envelope corresponds to the 95th and 5th quantiles of the distribution of 10000 variograms obtained after random permutations of the environmental data. Squares represent significant values, i.e. values below the 5th quantiles or above the 95th percentile. The vertical line corresponds to the distance beyond which the variogram is not interpretable, i.e. half the maximum distance between villages. The last graph shows a histogram of hamlet distances.

