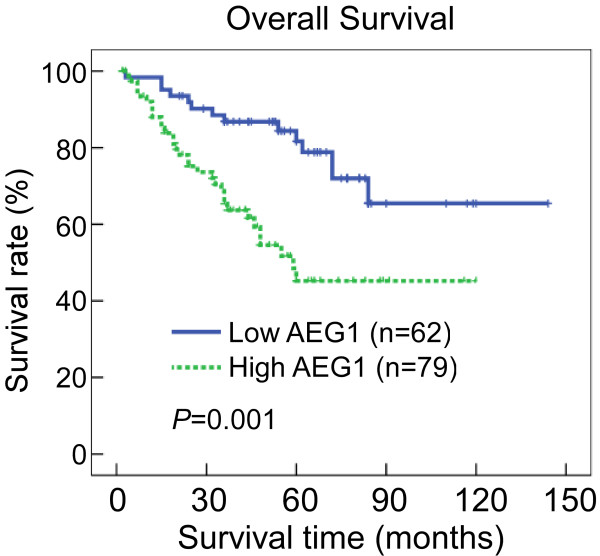
Figure 3.
Kaplan-Meier curves with univariate analyses (log-rank) for patients with low AEG-1 expression (bold line) versus high AEG-1 expression tumors (dotted line). The cumulative 5-year survival rate was 78.4% in the low AEG-1 protein expression group (n = 62), whereas it was only 45.0% in the high AEG-1 expression group (n = 79).

