Figure 3.

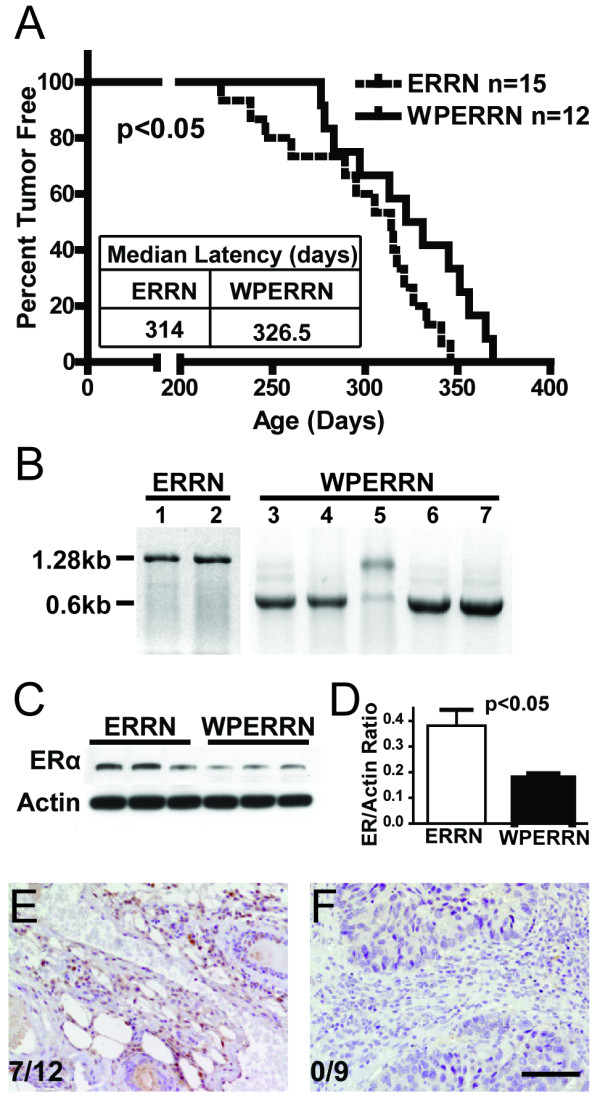
Tumor characteristics of ERRN and WPERRN mice. (A) Tumor latency plotted on a Kaplan-Meier curve showing percentage of ERRN (n = 15) versus WPERRN (n = 12) mice that were tumor free versus time (p < 0.05, log-rank test). (B) DNA bands resulting from conventional PCR on genomic DNA isolated from tumor tissue of ERRN and WPERRN mice. Cre-mediated recombination results in ERα knockout tumor tissue, shown by the presence of a 0.6 kb PCR product; while the wild-type ERα product is 1.28 kb. (C) Western blot of ERα on tumor tissue lysates from ERRN and WPERRN mice with (D) quantification. (E, F) Immunohistochemical staining for ERα on mammary tumor sections from ERRN and WPERRN mice. Numbers represent the proportion of animals in each genotype that developed ER-positive tumors. Scale bar = 50 μm.
