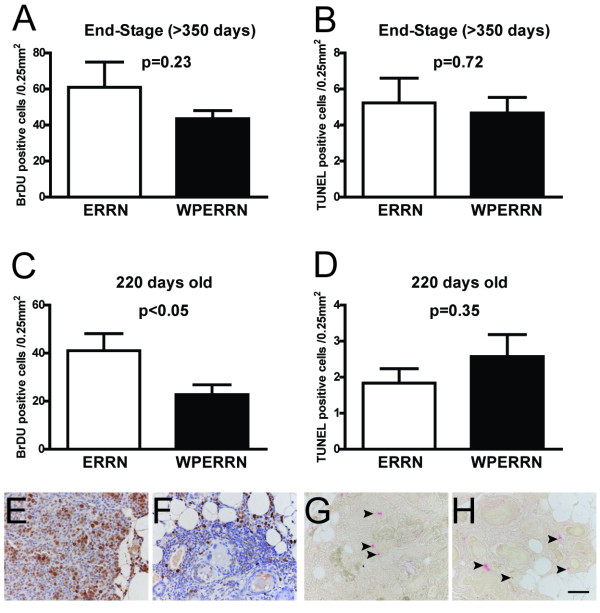
Figure 4.
Analysis of proliferation and cell death in ERRN and WPERRN tumors. BrDU immunohistochemical staining was performed on end-stage tumors (> 2 cm3) (A) and mice with neoplasias at 220 days old (C). Bars represent the average number of positive cells per field of view (0.25 mm2). Pictures (E) and (F) correspond to ERRN (n = 7) and WPERRN (n = 7) representative examples, respectively. TUNEL staining was performed on end-stage tumors (B) and 220 day old mice (D). Bars represent the average number of positive cells per field of view (0.25 mm2). Pictures (G) and (H) correspond to ERRN (n = 7) and WPERRN (n = 7) representative examples, respectively. Scale bar = 50 μm.

