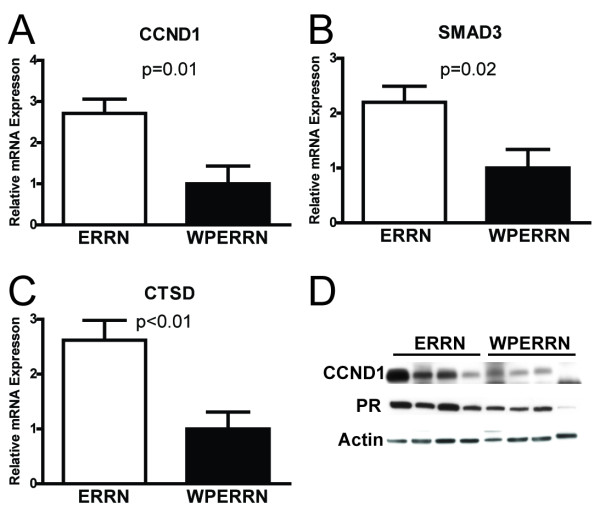
Figure 6.
Expression changes of ER-regulated genes. (A, B, C) Bars represent the relative mRNA expression levels between ERRN (n = 7) and WPERRN (n = 7) tumor lysates, quantified by qPCR. The ER-regulated genes (A) CyclinD1 (CCND1) (B) SMAD3 and (C) cathepsin D (CTSD) were analyzed (t-test). (D) Protein lysates were also analyzed by Western blotting for expression of cyclin D1 and progesterone receptor.

