Figure 7.

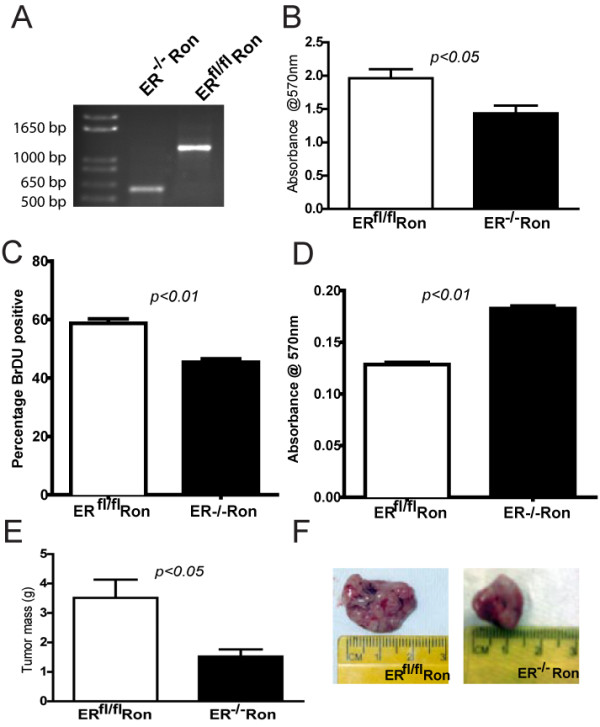
Characterization of ERfl/flRon and ER-/-Ron cells. (A) PCR analysis of genomic DNA confirming the presence of the wild-type ERα allele (1280 bp) in ERfl/flRon cells and the knockout allele (600 bp) in ER-/-Ron cells. (B) Bars represent the absorbance measured at 570 nm following MTT assay on ERfl/flRon and ER-/-Ron cells (n = 8). (C) Bars represent the percentage of BrDU positive cells per 10 × field of ERfl/flRon and ER-/-Ron cells following BrDU incorporation (n = 6 independent experiments with 6-8 fields counted per genotype/experiment). (D) Bars represent the absorbance measured at 570 nm following a transwell migration assay on ERfl/flRon and ER-/-Ron cells (n = 4 independent experiments performed in triplicate). (E) Bars represent the mean mass of the tumors established from orthotopic injections of ERfl/flRon and ER-/-Ron cells (n = 7 mice per cell line) into the fat pads of athymic nude mice a time of sacrifice (10 weeks post injection). All means were compared by student's t-test. (F) Representative photographs of tumors established from orthotopic injections of ERfl/flRon and ER-/-Ron cells into the fat pads of athymic nude mice.
