Abstract
Reported mechanical properties of orbital connective tissue and fat have been too sparse to model strain–stress relationships underlying biomechanical interactions in strabismus. We performed rheological tests to develop a multi-mode upper convected Maxwell (UCM) model of these tissues under shear loading. From 20 fresh bovine orbits, 30 samples of connective tissue were taken from rectus pulley regions and 30 samples of fatty tissues from the posterior orbit. Additional samples were defatted to determine connective tissue weight proportion, which was verified histologically. Mechanical testing in shear employed a triborheometer to perform: strain sweeps at 0.5–2.0 Hz; shear stress relaxation with 1% strain; viscometry at 0.01–0.5 s−1 strain rate; and shear oscillation at 1% strain. Average connective tissue weight proportion was 98% for predominantly connective tissue and 76% for fatty tissue. Connective tissue specimens reached a long-term relaxation modulus of 668 Pa after 1,500 s, while corresponding values for fatty tissue specimens were 290 Pa and 1,100 s. Shear stress magnitude for connective tissue exceeded that of fatty tissue by five-fold. Based on these data, we developed a multimode UCM model with variable viscosities and time constants, and a damped hyperelastic response that accurately described measured properties of both connective and fatty tissues. Model parameters differed significantly between the two tissues. Viscoelastic properties of predominantly connective orbital tissues under shear loading differ markedly from properties of orbital fat, but both are accurately reflected using UCM models. These viscoelastic models will facilitate realistic global modeling of EOM behavior in binocular alignment and strabismus.
Keywords: Biomechanics, Cow, Extra-ocular muscle, Oculomotor mechanics, Pulley, Strabismus
1 Introduction
The mechanical properties of extraocular tissues are attracting increasing experimental interest of investigators interested in ocular motility. Detailed mechanical characterization of these tissues is crucial to quantitative understanding of strabismus, the pathological misalignment of the eyes. However, approaches to characterize biosolids have varied among investigators, with some treating soft tissues as discrete systems composed of simplified springs and dampers (Bilston et al. 1998; Bilston and Thibault 1996; Lanir 1979; Liu and Bilston 2000; Shoemaker et al. 1986), while others treat them as time dependent continuous elastic systems (De Hoff 1978; Fung 1967; Pinto and Fung 1973; Yoo et al. 2009). Prior studies, including those of Robinson et al. (1969), Collins et al. (1981), Simonsz 1994 and Yoo et al. (2009), have appreciated some active and passive behavior of extraocular muscles (EOMs), but biomechanical characterization of orbital connective tissue and fat has been largely neglected in the field of ocular motility. A rare exception has been the study of bovine retrobulbar tissue by Schoemaker et al. (2006), which nonetheless did not differentiate orbital fat from connective tissue. Biomechanical properties of orbital connective tissue have been typically neglected or arbitrarily assumed in simulation studies of extraocular mechanics.
Discovery of the orbital pulley system motivated efforts to clarify the mechanical properties of the orbital connective tissues. Imaging studies in monkeys (Miller and Robins 1987) and humans (Simonsz et al. 1985) demonstrated that rectus EOM bellies, rather than taking shortest distance paths, instead have paths that are largely stable in the orbit over the full range of gaze directions (Miller 1989). In secondary and tertiary gazes, rectus and inferior oblique EOM paths are sharply inflected at locations coinciding with connective tissue rings encircling the EOMs into which the orbital layer EOM fibers insert (Demer et al. 2003). These connective tissue rings, consisting of densely woven collagen reinforced by elastin, are termed the pulleys. Rectus pulleys are located posterior to the globe equator in Tenon’s fascia (Demer et al. 1995) and mechanically coupled to the orbital walls and adjacent pulleys via connective tissue bands or ligaments. These connective structures are uniform among most individuals and are composed of collagen, elastin, and sometimes also smooth muscle (Kono et al. 2002). While there is fat distributed among the EOMs posterior to the globe and pulley system, the relative contributions of pulley tissues versus fat to orbital biomechanics remain poorly delineated.
From the point of view of biomechanics and solid mechanics, a material is said to be comprehensively defined when its constitutive relation is characterized by a mathematical equation describing the material behavior (Fung 1993). In contrast to tensile force or deformation perpendicular to the surface of a material, shear is defined to be a force or displacement parallel to the surface of a material. Both tensile and shear characterization are required for complete understanding of a material and can be specified by constitutive equations. A constitutive equation is a relation between two physical quantities that is specific to a material and approximates that material’s response to external forces. In structural analysis, constitutive relations relate applied stresses or forces, to strains or deformations.
Although biomechanical properties of sclera and associated connective tissue have been previously investigated (Bellezza et al. 2003; Downs et al. 2003, 2005), there has been no prior effort to develop constitutive relations that would accurately predict stress, the internal force, induced by strain (displacement) in the orbital connective tissue system, which consists of dense collagenous connective tissue, embedded in orbital fat compartments having three-dimensional (3D) shapes. Such accurate constitutive mechanical models are required for implementation of a valid finite element (FE) model of the EOMs and orbit. As a first step toward FE simulation, it is necessary to develop a mechanical model that realistically predicts strain-dependent and time-dependent behavior of each significant tissue in the orbit.
Most biological tissues exhibit stress–strain behavior depending upon time and prior history in a manner resembling viscoelastic materials (Bilston et al. 1998; Galford and McElhaney 1970; Viidik 1966). Typically, soft tissues exhibit two important features: hyperelasticity and viscosity (Bilston et al. 1998; Fung 1993). Hyperelastic materials are defined as nonlinearly elastic, isotropic, incompressible, and having properties generally independent of strain rate (Beatty 1987; Miller and Chinzei 2002; Weiss et al. 1996. Time-dependent mechanical behavior, often reflected in mechanical hysteresis, is termed viscosity, a prominent feature of all soft tissues that leads to energy dissipation during deformation. Due to significance of viscoelastic characteristics in physiological functions of biosolids, much effort has been devoted to characterize nonlinear viscoelastic properties of soft tissues. Various theoretical models have been developed to describe tissues such as artery (Holenstein et al. 1980), brain (Bilston et al. 1998; Estes and McElhaney 1970; Galford and McElhaney 1970; Mendis et al. 1995; Miller and Chinzei 1997; Pamidi and Advani 1978), heart muscle (Huyghe et al. 1991; Maynewman and McCulloch 1998; Pinto and Fung 1973; Pinto and Patitucci 1980), kidney (Farshad et al. 1999; Nasseri et al. 2002; Schmidlin et al. 1996), liver (Liu and Bilston 2000), ligament (Lin et al. 1987) and tendon (Johnson et al. 1996; Pradas and Calleja 1990), skin (Chaudhry et al. 1998; Lanir 1979), and spinal cord (Bilston and Thibault 1996; Chaudhry et al. 1998). Despite varying approaches, these theoretical models have successfully captured gross mechanical behavior that is influenced by mutually interacting structural components.
With widespread availability of great computing power, FE models, which represent continuous solids in discrete form by a finite number of elements, have become efficient tools to simulate complex 3D, nonlinear deformations of viscoelastic biomaterials. Nevertheless, FE models depend upon constitutive properties to such a strong extent that even modest errors in assumed mechanical properties can invalidate simulations. For instance, inappropriate application of a dynamic shear modulus in a static FE model would result in unrealistic results. Dynamic mechanical properties of a solid system are derived from vibratory loading conditions where inertial effects are not negligible. Since solids under dynamic loading tend to stiffen, moduli measured under oscillatory conditions tend to be higher than those measured under static conditions. Such misapplication of dynamic mechanical properties in a static FE analysis would clearly result in unrealistically high predicted stresses and unrealistically low predicted deformations.
Since both orbital connective tissue and fat exhibit nonlinear time-dependent responses inconsistent with a linear viscoelastic model, the present study employed a nonlinear differential constitutive equation for brain tissue developed by Bilston et al. (2001). As proposed in Nasseri et al. (2002); Bilston et al. (2001) and Phan-Thien et al. (2000), the model incorporates a nonlinear damping function modification on a coupled multi-mode convected Maxwellmodel with hyperelasticity, known as a Mooney-Rivlin elastic response.
The current study aimed to characterize the shear viscoelastic behaviors of orbital fat versus connective tissues through separate measurements of viscometry, stress relaxation, and dynamic testing. While complex extraocular structures such as pulleys would obviously have asymmetrical gross mechanical properties at the macroscale due to variations in overall size and shape, this investigation assumes that tissues are composed of isotropic material at the intermediate scale of the specimens tested. Of course, the intermediate scale isotropy assumption could nevertheless be consistent with connective tissue composed variably or randomly oriented collagen fibrils, for example, at the molecular scale. The resulting constitutive relationships for orbital connective tissue and fat are described in constitutive laws convenient for implementation in software packages that would permit FE modeling of orbital mechanics.
2 Methods
A preliminary anatomical study was performed on the bovine orbit to permit selection of specimens for mechanical study. One formalin-fixed orbit of an adult cow was removed en bloc from the skull with the periorbita intact, embedded in paraffin, serially sectioned at 10 mm thickness in the quasicoronal plane perpendicular to the long axis of the orbit as described elsewhere (Demer et al. 1995, 1997; Kono et al. 2002, 2005; Miller et al. 2003; Oh et al. 2001a,b. Sections were mounted on gelatin-coated glass slides, and stained with Masson trichrome stain. Although this processing dissolves away lipid, fat location can be inferred by the presence of thin membranes and nuclei of adipocytes. As described, sections were stained with Masson trichrome, which stains collagen blue, striated muscle red, and smooth muscle purple.
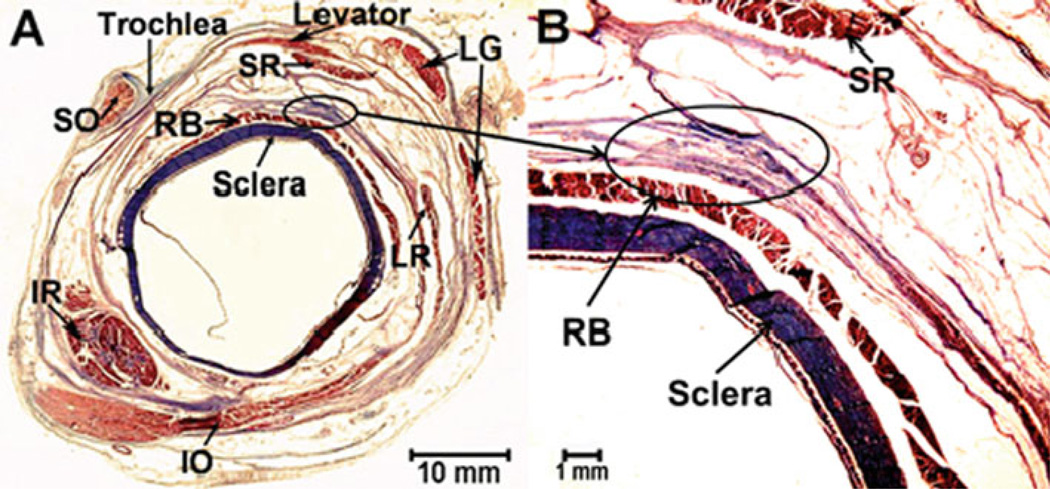
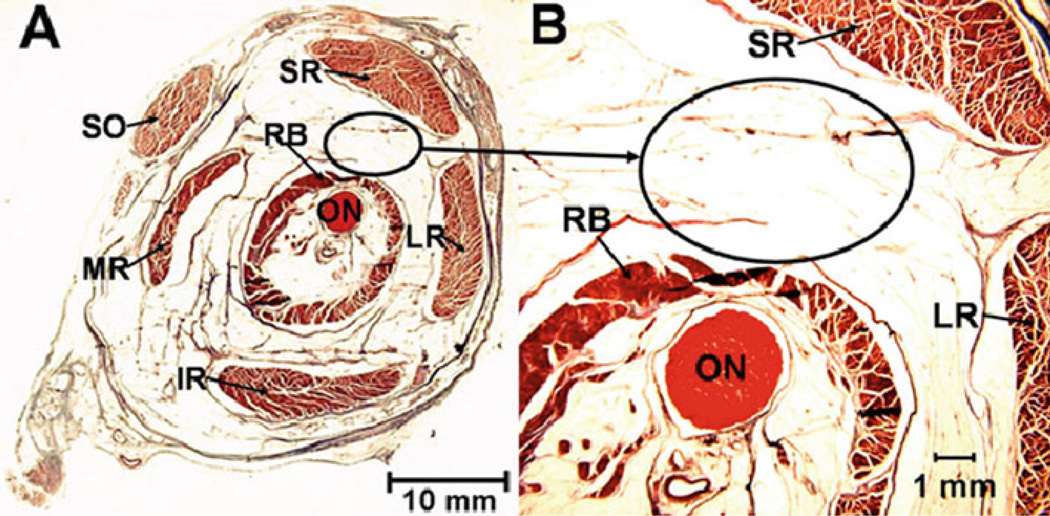
Fresh heads of adult cows were obtained from a nearby abattoir. In the laboratory, orbits were carefully dissected to extract EOMs and connective tissues. Transport time from abattoir to laboratory was approximately 30 min; the additional time required to dissect the tissues averaged 15 min. Predominantly connective tissue specimens were obtained in the anterior orbit from a broad band connecting the lateral rectus and superior rectus pulleys (Fig. 1). This structure was appropriately large and uniform for study and has grossly uniform characteristics of connective tissue. Fat specimens were obtained from the superolateral part of the deep orbit between the retractor bulbi and superior rectus muscles (Fig. 2). This region is readily accessible via dissection and has grossly uniform characteristics of fat.
Figure 1.
Location of the pulley tissue specimen, denoted by oval, in quasi-coronal histological section from a left anterior orbit as if from the front. Masson trichrome stain, 10 mm thick section. Collagen stains blue, and muscle stains red. a Low magnification. SR superior rectus muscle. LR lateral rectus muscle, IR inferior rectus muscle, SO superior oblique muscle, IO inferior oblique muscle, RB retractor bulbi muscle, LG lacrimal gland. b High magnification. The elliptical shape in the figure shows where the connective tissue specimens were extracted
Figure 2.
Location of the fatty tissue specimen, denoted by oval, in quasicoronal histological section from a left posterior orbit viewed as if from the front. Masson trichrome stain, 10 mm thick section. Collagen stains blue, and muscle stains red. SR superior rectus muscle, LR lateral rectus muscle, SO superior oblique muscle, MR medial rectus muscle, IR inferior rectus muscle, RB retractor bulbi muscle, ON optic nerve. The ellipse indicates where fatty tissue specimens were extracted. a Low magnification. b High magnification
After dissection, predominantly connective tissue and fatty tissues were maintained in lactated Ringer’s solution at 37°C. For characterization of the specimens, a torsional rheometer (AR 2000; TA Instruments Inc., New Castle, DE) was used to carry out strain sweep, stress relaxation, viscometry and dynamic tests.
Since precise specimen preparation was needed to reduce edge effect during testing, specimens were carefully cut into a disc shape 2 mm thick and 20 mm in diameter. After extraction of fat and predominantly connective tissue specimens having arbitrary shapes, specimens were cut into uniform slabs 2 mm thick by a slicer containing a series of silicon disc blades (Equal Z; Advanced Building and Fabrication, Chino, CA). Using a custom machined punch, slabs were then cut into 20 mm diameter discs, equal to the diameter of the rheometer’s upper rotating plate.
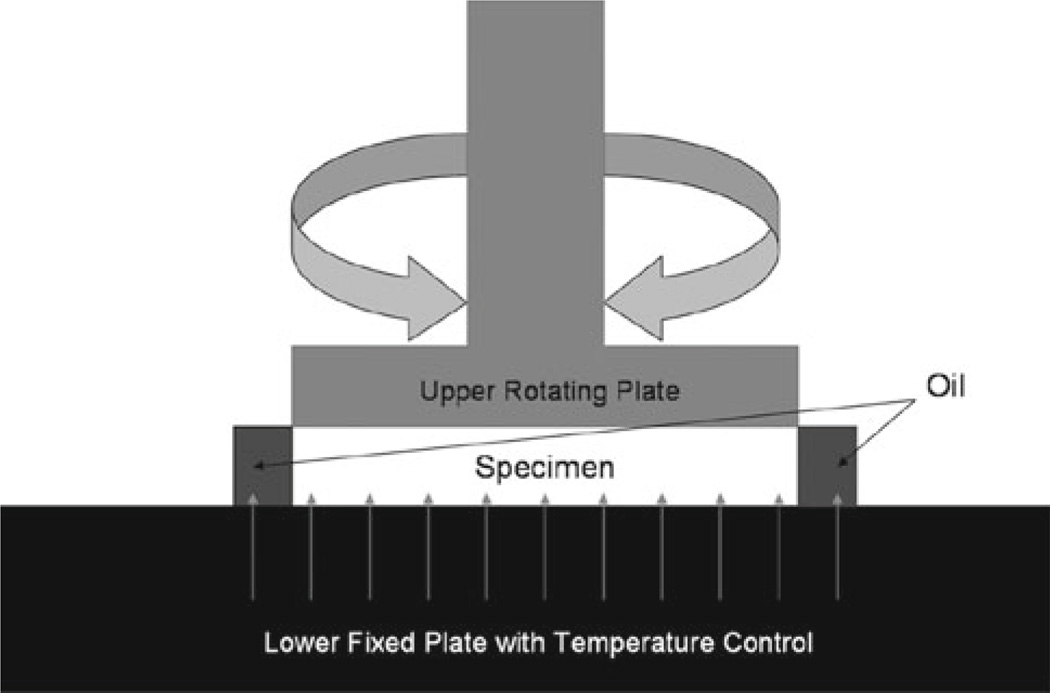
Also, in order to prevent high variability, which is often encountered in mechanical characterization of biological materials (Barbenel et al. 1973; Buchtal and Kaiser 1951; Jenkins and Little 1974), environmental conditions were optimized through physiologic temperature and humidity control. Constant irrigation with lactated Ringer solution at 37°C was applied not only during specimen preparation but also during the experiments; specimens were maintained on the rheometer at 37°C, with a corn oil seal applied to the edge to prevent evaporative dehydration. This configuration is shown in Fig. 3.
Figure 3.
The specimen was compressed between lower fixed plate and upper rotating plate. To prevent moisture loss, oil was applied around the specimen while physiologic temperature was maintained
To assess the possibility of slipping of upper plate over specimens during testing, preliminary experiments were carried out with and without sand paper affixed to the rotating upper plate. Sand paper has much greater friction than the rotating plate itself, so if the presence of sand paper had altered the findings, it would have been concluded that the specimen was slipping against the mobile plate in the absence of sandpaper. Since results were similar with and without sandpaper on the rotating plate, experiments reported here omitted sandpaper in order to reduce calibration time and edge effects.
Preconditioning establishes a standardized initial condition for the tissue and is considered essential for accurate and repeatable mechanical measurements of most biological tissues (Fung 1972; Johnson et al. 1996; Nasseri et al. 2002; Pinto and Fung 1973; Woo et al. 1980). From preliminary experiments, it was determined that 5–8 cycles at a slow strain rate was sufficient to reach stability in hysteresis response. All specimens were preconditioned in this way before testing.
2.1 Preliminary differentiation of predominantly connective tissue specimens and fatty tissue specimens
Preliminary anatomical studies were performed in orbits not subjected to biomechanical testing. From preliminary dissections, itwas determined that tissue between the retractor bulbi and rectus EOMs had less connective tissue and more fat than tissue near the presumed location of the pulleys. Dissection of multiple specimens confirmed the highly stereotypic nature of this specialization. Sixty specimens (30 of predominantly connective tissue from the pulley region, and 30 fatty tissue specimens from deep retrobulbar region between EOMs and retractor bulbi) were weighed before and after immersion in acetone for 10 days to extract the fat.
2.2 Histology
To validate the acetone extraction results, additional connective and fatty tissue specimens not subjected to acetone were examined histologically. Such preparation requires elution of fat using organic solvents. Representative samples were dehydrated in solutions of alcohol and xylenes, embedded in paraffin, and serially sectioned at a 10 mm thickness. Care was taken to achieve uniform, simultaneous staining of sections. Digital light micrographs in 24-bit color were made using amicroscope (E800N; Nikon, Tokyo, Japan) fitted with a digital camera (D1X; Nikon, Tokyo, Japan).
2.3 Strain sweep oscillation tests
To determine the limit of linear viscoelasticity, strain sweep oscillation was performed. Five preconditioned specimens were tested at each of four different frequencies: 0.5, 1.0, 1.5, and 2.0 Hz. To define possible nonlinearities, oscillations were conducted at constant frequency with varying strain amplitude from 0.1 to 150%. Unlike the conventional solid mechanical definition, strain here is defined as excursion of the circumference of the disk-shaped specimen divided by its thickness (Schoemaker et al. 2006). Within limit of linear viscoelasticity, dynamic properties such as complex shear modulus, elastic modulus, loss modulus and viscosity (G*, G′, G″, h) remain constant. Beyond the limit of linear viscoelasticity, dynamic properties change as material behavior becomes nonlinear.
2.4 Stress relaxation tests
To be able to characterize the time-dependent behavior of the tissue, the decay in stress at constant strain was recorded as a function of time. In a relaxation test, strain should ideally be imposed as rapidly as possible in order to approximate the instantaneous elastic response and then maintained constant while the corresponding stress induced in the tissue decreases with time. For each specimen type, 15 relaxation tests were performed using 1% fixed strain amplitude and 0.02 s rise time. Samples were 20 mm in diameter and 2 mm thick. Relaxation modulus, defined as the ratio of shear stress to imposed strain, was measured for 2,000 s. From stress relaxation test results, elastic and viscous stress parameters were extracted using nonlinear least square fitting.
2.5 Constant shear rate (viscometry) tests
For each specimen type, stress in 20 different samples was observed subjected to four different constant shear rates: 0.01, 0.05, 0.1, and 0.5 s−1. From the viscometry results, damping function parameters were determined in the same manner that elastic and viscous parameters were extracted from stress relaxation data.
2.6 Small-amplitude oscillatory motion (dynamic testing)
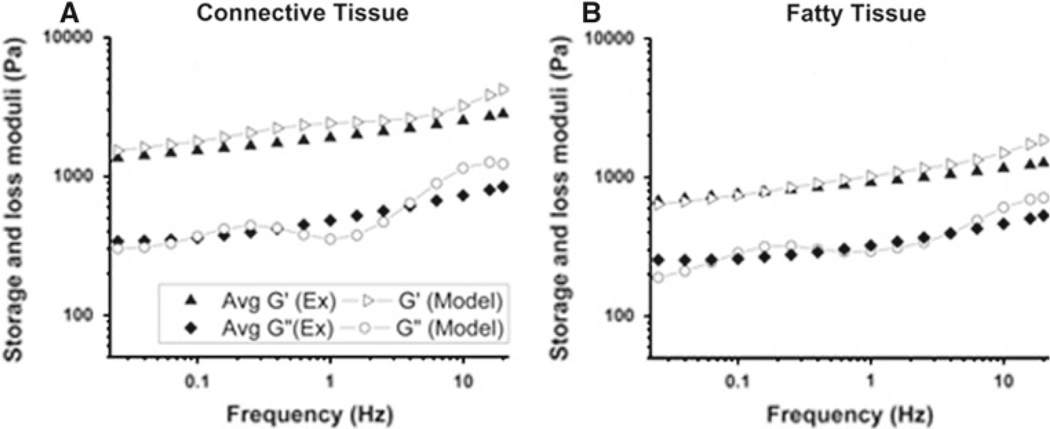
Storage and loss moduli G′ and G″ were determined as functions of frequency over the range 0.01–20 Hz. Strain was fixed at 1%, the limit of the linear viscoelastic region that had been determined from strain sweeps. Fifteen specimens of predominantly connective tissue and 15 of fatty tissue were tested. Since the ratio of loss modulus to storage modulus indicates the amount of strain energy lost relative to the energy stored per cycle, dynamic testing can validate predictions of models derived from both stress relaxation and viscometry. Results of dynamic tests were compared with predicted values from a model described below.
2.7 Viscoelastic modeling
As appropriate to specimen geometry, we employed the viscoelastic framework developed by Nasseri et al. (2002) and Phan-Thien et al. (1997). Specimens were modeled as homogenous and isotropic. This was reasonable since the potential degree of anisotropy is unknown for both types of specimens, and the orientation of microstructures within specimens is so irregular that specimens resemble isotropic material at the macroscale.
As derived in the Appendix, the j-th mode of viscoelastic stress evolves in time. The equations to be established are
| (1) |
for stress relaxation modulus with ηj being viscosity and λj being relaxation constant of mode j. f is the damping function, γ0 is the strain amplitude and GE is an arbitrary constant to be found.
Shear stress as a function of constant shear rate γ̇ is given by:
| (2) |
Elastic and loss moduli are respectively in the forms of:
| (3) |
| (4) |
for frequency ω. All required parameters can be extracted from Eqs. 1 and 2 by nonlinear least square fitting to experimental results from stress relaxation and viscometry. Equations 3 and 4 are used to validate model predictions. Further theoretical details are included in the Appendix.
3 Results
3.1 Quantitative tissue composition
Based on acetone extraction, the average connective tissue weight proportion of predominantly connective tissue was 98% ± 1.2%, but was 76% ± 1.2% for fatty tissue from the retrobulbar region. For convenience, specimens with weight proportion of 98% will be considered “connective tissue,” while the mixture that yielded 76% mass proportion of connective tissue will be considered “fatty tissue.”
3.2 Histology
Figure 4 shows Masson’s trichrome stained histological sections of connective tissue (A) and fatty tissue (B) specimens. As seen in Fig. 4a, connective tissue stains darker blue, indicating more collagen. As seen in Fig. 4b, fatty tissue specimens contained less blue staining collagen and more numerous fatty voids. From consistent evidence provided by acetone extraction and histology, it was obvious that compositions of connective tissue and fatty tissue specimens differed substantially.
Figure 4.
Micrograph of connective tissue and fatty tissue stained with Masson trichrome. a Blue staining collagen was dense in connective tissue, but conspicuously less dense in fatty tissue b
3.3 Strain sweep oscillation testing
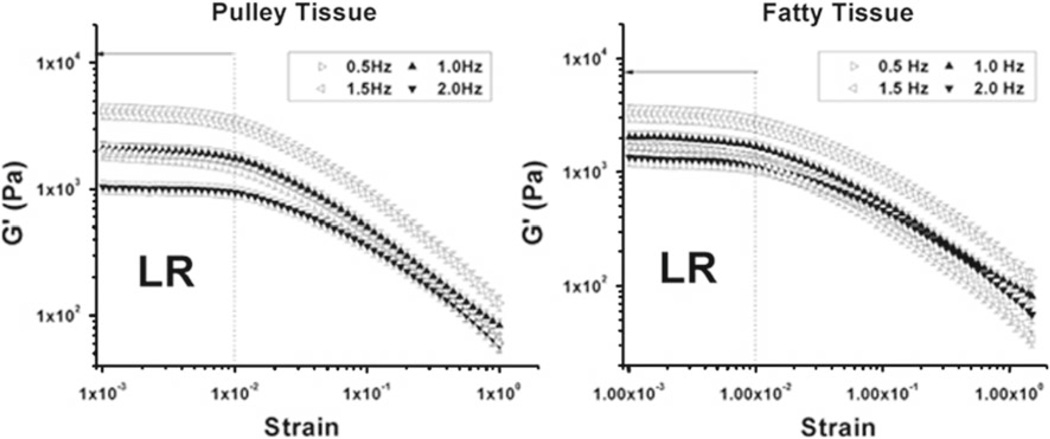
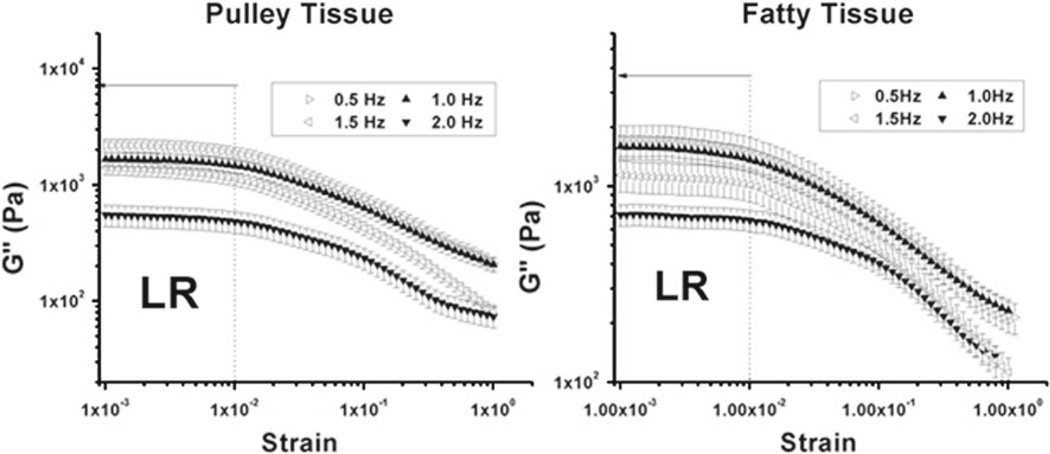
Values of elastic and loss modulus for both connective (Fig. 5) and fatty (Fig. 6) tissue were maximal at low strain frequency and decreased logarithmically with increasing strain and were generally higher for lower frequency strain sweeps. An exception was that the elastic modulus at 1.5 Hz for fatty tissue was higher than at 2.0 Hz. The objective of strain sweep oscillation testing was to determine the linear region for strain in each specimen type to determine suitable test conditions for subsequent experiments. As shown in Figs. 5 and 6, consistent linear regions of both elastic and loss moduli were observed for both connective and fatty tissue. Dynamic properties of both connective and fatty tissue specimens were linear below approximately 0.01 strain, but properties changed nonlinearly for greater strain. Therefore, the strain linear viscoelastic limit for both connective and fatty tissue specimens was taken to be 0.01.
Figure 5.
Strain sweep oscillation data demonstrating average elastic modulus (G′) versus strain at four different frequencies (0.5, 1.0, 1.5 and 2.0 Hz), for 5 specimens at each frequency. Region LR represents the region of linear viscoelasticity, up to 0.01 strain. Connective (a) and fatty (b) tissue specimens exhibited linear viscoelasticity at all four frequencies
Figure 6.
Strain sweep oscillation data for 20 specimens demonstrating average loss modulus (G″) versus strain at four different frequencies (0.5, 1.0, 1.5 and 2.0Hz). Region LR represents the region of linear viscoelasticity, up to 0.01 strain. a Connective tissue. b Fatty tissue
3.4 Stress relaxation testing
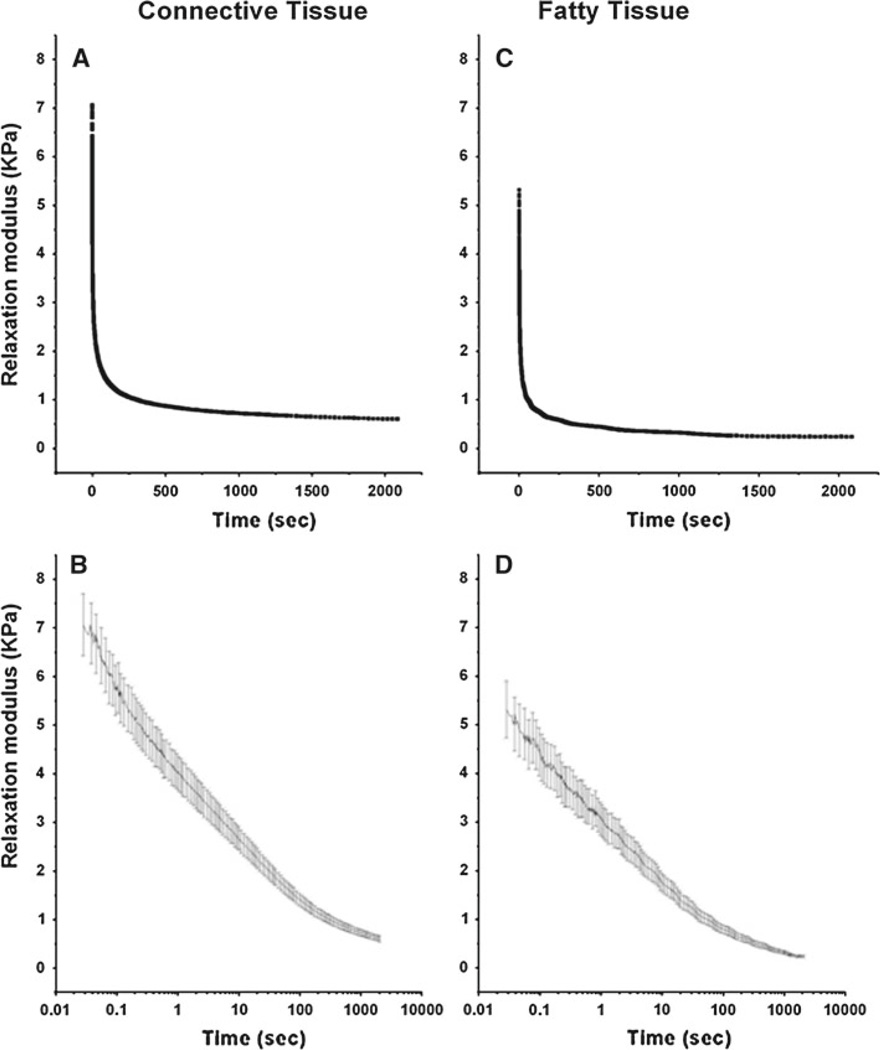
Figure 7 shows the average relaxation modulus GE as a function of time for 15 connective and fatty tissue specimens each. The relaxation modulus for connective tissue reached an asymptote of 668 Pa after 1,500 s (Fig. 7a), while for fatty tissue a lower asymptotic value of 290 Pa was reached at shorter time of 1,100 s (Fig. 7c). Peak relaxation modulus values for connective tissue and fatty tissue also differed markedly. Values for peak relaxation modulus after initial ramp loading were 7,067 ± 692.6 Pa (Fig. 7b) and 5,319 ± 632.8 Pa (Fig. 7d) for connective and fatty tissue, respectively. This indicates that connective tissue is stiffer than fatty tissue.
Figure 7.
Mean stress relaxation data for 15 predominantly connective tissue samples, plotted on both linear (a) and semi-logarithmic (b) scales. Mean stress relaxation data for 15 fatty tissue samples, plotted on both linear (c) and semi-logarithmic (d) scales. Peak relaxation modulus for connective tissue was 7,067 ± 693 Pa while the long-term asymptotic relaxation modulus of 668 Pa was reached after about 1,500 s. Peak relaxation modulus value for fatty tissue was 5,319 ± 633 Pa while the long-term asymptotic relaxation modulus of 290 Pa was reached after about 1,100 s
3.5 Viscometry
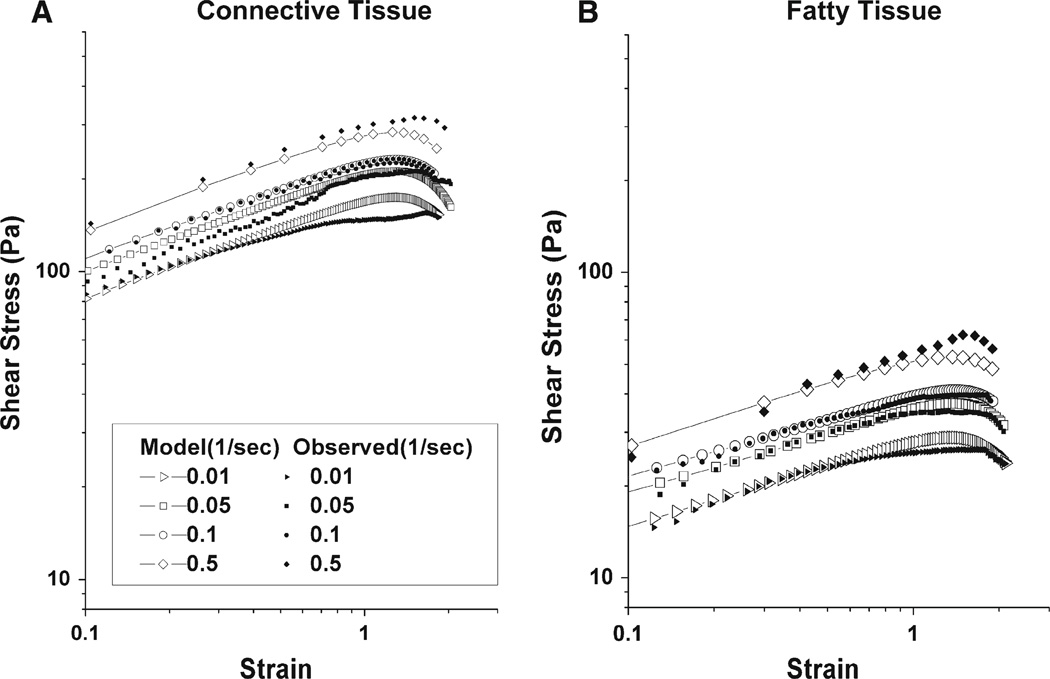
Figures 8a, b show stress–strain curves on log-log scales at different shear rates for connective and fatty tissue specimens, respectively. Each line represents the mean of five trials at a different shear rate. Since the response after the material fails is uninformative, the data after the onset of slip are truncated in the plots. As can be seen in Fig. 8a, b, there was a trend increasing stress with increasing shear rate. The peak stress in each curve represents rupture stress. It can be seen in Figs. 8 and 9 that there was accretion of rupture stress with increasing shear rate. Rupture strains, the strains corresponding to rupture stresses, remain roughly constant for all four different shear rates in Fig. 8. Connective tissue exhibited more than three-fold higher stress than the fatty tissue.
Figure 8.
Mean shear stress of five specimens as strain increased at various shear rates (1/s). Solid symbols represent experimental data, while open symbols represent model values. a Connective tissue. Rupture occurred around strain 1.6. b Fatty tissue. Rupture occurred around strain 1.8
Figure 9.
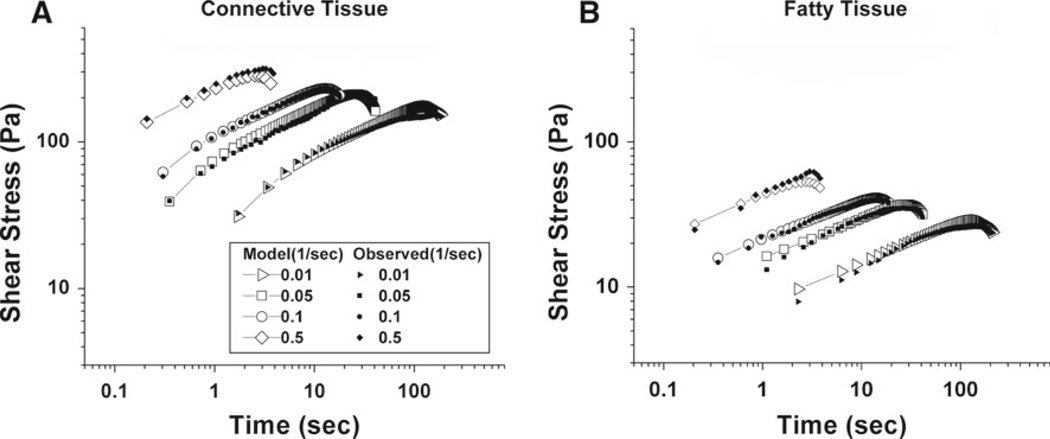
Mean shear stress of 5 samples as a function of time for shear rates of 0.01, 0.15 0.10 and 0.50 (1/s). Solid symbols represent experimental data, while open symbols represent model values. Shear stress increased with shear rate, and specimens failed faster at higher shear strain rates since all comparable specimens failed at similar strain. Error bars have been omitted for clarity. a Connective tissue. b Fatty tissue
Curves in Fig. 9a, b represent same shear stress versus strain data plotted in Fig. 8, but as functions of time at four different shear rates. Similar to the behavior in Figs. 8a, b, and 9a, b also illustrate an increase in the rupture stress with increasing shear rate. Failure also occurred earlier with higher strain rates (Fig. 9a, b), consistent with the finding that rupture strain was essentially constant over all shear rates.
3.6 Parameter extraction
From stress relaxation and viscometry data for connective and fatty tissues, parameters needed to assemble constitutive models of each were extracted by means a nonlinear least square fitting method (MATLAB version 6.5, The Math-works, USA). The extracted parameters are listed in Table 1.
Table 1.
Modeled tissue parameters
| Connective tissue | Fatty tissue | P values for η′s | ||
|---|---|---|---|---|
| Viscoelastic stress parameters (±SD) | ||||
| λ1c= 0.001 | η1c= 15.7 ± 0.50 | λ1f= 0.1 | η1f= 1.5 ± 0.0 | 4.61 × 10⁻⁷ |
| λ2c= 0.01 | η2c= 25.1 ± 2.22 | λ2f= 0.01 | η2f= 10.3 ± 0.097 | 9.76 × 10⁻⁵ |
| λ3c= 0.5 | η3c= 2.50 ± 0.20 × 10² | λ3f= 0.1 | η3f= 25.6 ± 0.49 | 1.49 × 10⁻⁵ |
| λ4c= 1.0 | η4c= 2.70 ± 0.22 × 10² | λ4f= 0.5 | η4f= 75.4 ± 0.77 | 3.10 × 10⁻⁵ |
| λ5c= 5.0 | η5c= 8.61 ± 0.35 × 10² | λ5f= 1.0 | η5f= 3.76 ± 0.080 × 10² | 2.55 × 10⁻⁶ |
| λ6c= 10.0 | η6c= 1.25 ± 0.082 × 10³ | λ6f= 5.0 | η6f= 6.17 ± 0.14 × 10² | 5.65 × 10⁻⁵ |
| λ7c= 25.0 | η7c= 7.46 ± 0.32 × 10³ | λ7f= 25.0 | η7f= 5.06 ± 0.090 × 10³ | 4.30 × 10⁻⁵ |
| λ8c= 250.0 | η8c= 4.97 ± 0.40 × 10⁴ | λ8f= 250.0 | η8f= 6.16 ± 0.16 × 10⁴ | 2.07 × 10⁻³ |
| λ9c= 500.0 | η9c= 9.12 ± 0.60 × 10³ | λ9f= 500.0 | η9f= 2.03 ± 0.034 × 10³ | 1.23 × 10⁻⁵ |
| λ10c= 1,000.0 | η10c= 1.35 ± 0.099 × 10⁴ | λ10f= 1,000.0 | η10f= 1.20 ± 0.092 × 10⁴ | 1.83 × 10⁻² |
| Damping function parameters | ||||
| Γ1c= 29.5 ± 2.6 | Pc = 2.0 | Γ1f= 2.15 ± 0.18 × 10² | Pf = 2.0 | |
| Γ2c= 0.41 ± 0.050 | nc = 6.54 ± 0.33 | Γ2f= 0.37 ± 0.016 | nf = 6.51 ± 0.33 | |
| Γ3c= 0.60 ± 0.035 | mc = 0.440 ± 0.020 | Γ3f= 0.060 ± 0.0032 | mf = 0.435 ± 0.020 | |
| Elastic and viscous stress parameters | ||||
| GEc = 8.59 ± 0.43 × 10² | ac = 0 | GEf = 3.08 ± 0.16 × 10² | af = 0 | |
| qc = 0.002 | Kc = 0.01 | qf = 0.002 | Kf = 0.01 | |
Since a multi-mode UCM model requires extraction of multiple parameters from experimental results, it was important to assess the fitted parameters statistically to assure that the curve fitting method was robust. Data from each of the 15 trials for each tissue type were randomly assorted into five subgroups of five samples each from connective tissue, and a similar five subgroups from fatty tissue. The parameter extraction algorithm was applied to each subgroup, so that each parameter for each tissue type was computed five times from a different data subset. This bootstrap method permits estimation of the variability of each fitted parameter by a conventional standard deviation and allows comparison with the overall fit that was obtained by averaging the 15 trials before fitting (Table 1). For each of the ηc’s and ηf’s, maximum variations from the overall fit were 12.9 and 13.4%, respectively. Values for damping function, elastic and viscous stress parameters all fell within 8.9% of parameters extracted from the overall fit. Parameters (η’s) for fatty tissue differed significantly from parameters for connective tissue (P<0.02, Table 1).
As seen from stress–strain curves in Fig. 8a, b, both the connective tissue and fatty tissue models generally predicted the data well. However, there were modest disparities between predicted and experimental values at the highest and lowest strain rates. Figure 9a, b compares both models’ predictions of stress versus time with experimental values. For shear rates 0.05 and 0.1 s−1, the connective tissue model agrees within 1.8 and 1.4% of mean experimental values, respectively. For shear rates 0.01 and 0.5 s−1, model values are within 8.2 and 8.6% of experimental values. Model predictions and experimental data for fatty tissue are shown in Fig. 9b. For shear rates 0.01, 0.05 and 0.1 s−1, predicted values are within 9.8% of experimental data.
3.7 Dynamic tests
To validate the model assembled from parameters extracted from previous experiments, dynamic tests were carried out on 15 connective tissue and 15 fatty tissue specimens. The experimental values and predicted values from the assembled model agree well for both connective tissue and fatty tissue specimens. However, with increasing frequency, model predictions deviate increasingly from experimental values. Also, as seen in Fig. 10a, b, the loss moduli for connective tissue and fatty tissue were similar, while the elastic modulus for connective tissue was about double that of fatty tissue.
Figure 10.
Observed and predicted elastic (G′) and loss (G″) moduli for connective (a) and fatty (b) tissues. Experimental values average 15 trials. Predicted elastic modulus agrees within 13% of experimental values for both connective and fatty tissue. Predicted loss modulus values match data well at lower frequencies but at high frequencies deviate from experimental values by up to 45% for connective tissue
4 Discussion
Simplifications are inevitable in biomechanical modeling. This study assumed homogeneity and isotropy of specimens—that is, that samples have uniform composition and that their mechanical properties are the same in all directions. On the macroscale applicable to relatively large tissue samples, these simplifying assumptions seem reasonable, but both assumptions would inevitably fail at the some fine scale, for example at the scale of bundles of individual collagen fibers in a hydrated glycoprotein matrix. At the present time, anisotropic models would be too complex to implement. The present study also assumed a linear viscoelastic relaxation modulus, which also seems a reasonable starting point for quantitative modeling. Hooke’s Law is a description of linear elastic behavior, in which deformation is linearly proportional to deforming force. The QLV formulation further assumes hyperelasticity, which allows a nonlinear (neo-Hookean) relationship between force and deformation. The QLV formulation is commonly employed in biomechanics, because it matches uniaxial data well and gives a linear Hookean response (Mendis et al. 1995) when higher order terms are omitted from the strain energy potential (Miller and Chinzei 1997).
Although the mathematical derivation is more complicated, multi-mode UCM is a modern rheological formulation that describes shear behavior of a viscoelastic material based upon Maxwell relaxation and strain energy (Nasseri et al. 2002; Phan-Thien et al. 1997). Except for EOMs themselves, extraocular tissue geometry is unsuitable for uniaxial testing, and UCM models cannot describe the strain-time inseparability of soft tissue under low strain (Bilston et al. 2001). The UCM formulation assumes isotropy and homogeneity, an approach used by Bilston et al. (2001) and Nasseri et al. (2002) that was considered appropriate for current study since the potential anisotropy and homogeneity of extraocular tissue are unknown. This is a reasonable initial approach, since well-established multi-mode UCM models are often used to describe constitutive properties in rheological studies of other biomaterials. For example Nasseri et al. (2002), characterized pig kidney using a multi-mode UCM model that closely matched observed data.
The connective and fatty tissue models developed in the current study combine a multi-mode UCM formulation to represent viscoelastic characteristics, with the response of a Mooney-Rivlin material, and an extension of Hooke’s Law for a large deformation to characterize hyperelasticity. The sum of the elastic and viscoelastic contributions is then modified by a strain-dependent damping function. As confirmed by viscometry and dynamic testing, each mechanical model for connective and fatty tissues makes accurate general predictions based upon only single parameter set derived from a subset of experimental data. In each case, the damping function reduces to unity at infinitesimal strain, at which each model reduces to a multi-mode Maxwell model with shear rate-dependent viscosity. The multi-mode UCM models, based on parameters derived from nonlinear least square fitting to both stress relaxation and a subset of viscometry data, predicted elastic and loss modulus to within 13% of experimental values. Predicted shear stress values for different shear rates during viscometry were within 12% of experimental values. These findings present study demonstrate that multi-mode UCM is a reasonable formulation for predicting shear stress, elastic modulus, and loss modulus over a broad range of shear rates and strain levels in connective and fatty tissue of the bovine orbit.
Values obtained from dynamic testing of both elastic modulus and loss modulus observed here for orbital fatty tissue are similar to those reported by Schoemaker et al. for an unspecified mixture of orbital fat and connective tissue of calves (Schoemaker et al. 2006); these investigators did not attempt to separate fatty from connective tissue. In the present study, all 10 viscoelastic stress parameters fitted to fatty tissue differed significantly from those for connective tissue. It is notable that both elastic and loss modulus values for connective tissues observed here exceeded corresponding values for fatty tissues by two-fold (Fig. 10a, b), so Schoemaker et al. presumably tested fatty rather than connective tissue. Pulley tissue, which is highly collagenous and sparsely deposited with fat, generates higher dynamic moduli and high shear stress values than predominantly fatty tissue. Rupture stress and sheer stress values were three- and five-fold higher for connective than fatty tissues, respectively. From the results, it can be inferred that bovine orbital connective tissue, which contains 98% nonfat tissue by mass, is mechanically stiffer than fatty tissue having 76% nonfat composition.
Since both physical and mathematical definitions of shear relaxation modulus and strain in the current study differ from conventional tensile definitions used in solid mechanics, direct parameter comparisons of current shear models with conventional tensile data would be inappropriate. However, some relative trends are comparable. Differences in elastic constant, GE between connective tissue and fatty tissue shear models indicate that connective tissue is stiffer, since it has a higher elastic constant. Furthermore, the stiffer connective tissue has a greater relaxation time constant than does fatty tissue. Although quantitative agreement should not be anticipated for the foregoing reasons, a two time constant (Tc) logarithmic quasi-linear viscoelastic equation as used for tensile characterization of human sclera was fitted to the current relaxation data for comparison of reported Tcs. In human sclera Downs et al. (2005), found a long Tc of 183 ± 82 s, which is comparable with the current value of 198 ± 16 s for fatty tissue; the long time constant for early glaucoma eyes of 252 ± 107 s was comparable with that of connective tissue at 245 ± 13 s. Possibly due to the difference in magnitude and rate of imposed ramp strain, current values of the short Tcs for connective and fatty tissue differed markedly from that reported for human sclera (Downs et al. 2005). Alternatively, the difference in short Tc might also reflect a real biomechanical difference between softer orbital tissues and sclera.
In summary, we report oscillatory and viscometric shear data on bovine orbital connective tissue and fatty tissue. The data were used to build constitutive models consisting of both hyperelastic and viscoelastic contributions. The viscoelastic component was modeled by a multi-mode UCM model tempered by a function representing strain softening behavior and partial failure. Multi-mode UCM models for connective and fatty tissue both accurately predicted shear and normal stress in shear flow. The present study demonstrates that the multi-mode UCM formulation is a good biomechanical description of the shear behavior of both orbital connective and fatty tissue. However, for a complete characterization, behavior under tensile loading should also be studied and modeled as future efforts. Parameters of models from the current study differ significantly between predominantly fatty deep orbital tissue versus predominantly collagenous connective tissues that are believed to comprise the orbital pulley system. While the current bovine mechanical parameters may not be identical to those of humans, it is likely that human fatty orbital tissues correspondingly differ from human orbital connective tissues. The mechanical parameters reported in the current study are suitable for implementation in widely used commercial FEA software that may be directly applied to orbital biomechanical simulations. The strikingly different mechanical properties of orbital fat versus connective tissues demonstrated here should be considered in such simulations.
Acknowledgments
We thank Manning Beef, LLC, Pico Rivera, CA, for their generous contribution of bovine specimens. We thank Jose Martinez, Claudia Tamayo and Ramiro Carlos for assistance with specimen preparation. We thank Vadims Poukens, M.D., Ph.D. for histological preparation and Andrew Shin for assistance with experimental procedures.
Support: Supported by US Public Health Service, National Eye Institute: grants EY08313 and EY00331, and Research to Prevent Blindness. J. Demer is Leonard Apt Professor of Ophthalmology.
Appendix
Viscoelastic modeling
Total stress for a viscoelastic solid consists of elastic and viscoelastic contributions:
| (1) |
where SE is elastic stress and SV is viscoelastic stress. As described by Nasseri et al. (2002), Treolar’s special form of rubber-like elasticity (Treloar 1975) was employed in this study:
| (2) |
where B is the Finger strain tensor, a deformation tensor commonly used in describing nonlinear fluid motion; f is a damping function of the strain invariants defined below; I1 = tr B, ; and GE and a are constants (Treloar 1975). Viscoelastic stress is described by an UCM model that is modified by f, the damping function of invariants I1 and I2. According to Phan-Thien et al. (1997), viscoelastic stress can be modeled by a differential form:
| (3) |
where
| (4) |
with λj the relaxation constants, L = ∇υT, where υ is the velocity and ∇ is a del operator, J2 the second invariant of strain rate tensor, D the strain rate tensor, ηj = Gjλj is the viscosity of mode j = 1, …, N, and Gj is the rigidity modulus of mode j.
The damping function was taken from Phan-Thien et al. (1997):
| (5a) |
with
| (5b) |
where p, m, β, Γ1 and Γ2 are constants.
Specimens were initially at rest between two parallel plates for relaxation testing. With rise time set to 0.02 s, a constant shear rate γ̇0 = 0.1 s−1 lasting only for brief time interval ε was imposed at time t < 0.02 s. The sample had undergone a total strain of magnitude γ0 = 0.1ε by time t = 0.02 s. For time t > 0.02 s, the shear rate was zero. During this time, measurement of subsequent decay of the shear stress was of interest. Ignoring the initial ramp-up, the elastic shear stress is given by
| (6) |
while the viscoelastic contribution for each mode j obeys the following equations:
| (7) |
Solving the above ordinary differential equation yields,
| (8) |
gives the total shear stress as
| (9) |
From the results of relaxation tests, above Eq. 9 was characterized.
Three prominent phenomena can be observed in simple shear flow with constant shear rate γ̇: the accretion of shear stress, attainment of peak stress, and finally specimen rupture. As suggested by Nasseri et al. (2002), a good approximate solution can be obtained by treating f (γ) as if it were a constant in Eq. 3. This leads to
| (10) |
which was characterized through viscometry data.
By determining the dynamic properties, the relaxation modulus can be calculated, or the dynamic properties can be calculated from measured dynamic properties, since all flows at small strains are considered equivalent and interrelated (Nasseri et al. 2002; Phan-Thien et al. 1997). Imposed strain in small strain oscillatory flow is simply γ = γ0 sin ωt, where the strain amplitude γ0 ≪ 1. The shear stress then is S = G′γ0 sin ωt + η′ωγ0 cos ωt. When f approaches unity, the dynamic properties are given by the constitutive model
| (11a) |
| (11b) |
| (11c) |
These Eq. 11a–c were used to validate the model assembled from the several different types of experiments.
Footnotes
Open Access This article is distributed under the terms of the Creative Commons Attribution Noncommercial License which permits any noncommercial use, distribution, and reproduction in any medium, provided the original author(s) and source are credited.
Contributor Information
Lawrence Yoo, Department of Ophthalmology, Jules Stein Eye Institute, University of California, 100 Stein Plaza, UCLA, Los Angeles, CA 90095-7002, USA; Department of Mechanical Engineering, University of California, Los Angeles, USA.
Vijay Gupta, Department of Mechanical Engineering, University of California, Los Angeles, USA; Biomedical Engineering Interdepartmental Program, University of California, Los Angeles, USA.
Choongyeop Lee, Department of Mechanical Engineering, University of California, Los Angeles, USA.
Pirouz Kavehpore, Department of Mechanical Engineering, University of California, Los Angeles, USA.
Joseph L. Demer, Department of Ophthalmology, Jules Stein Eye Institute, University of California, 100 Stein Plaza, UCLA, Los Angeles, CA 90095-7002, USA, jld@ucla.edu Biomedical Engineering Interdepartmental Program, University of California, Los Angeles, USA; Neuroscience Interdepartmental Program, University of California, Los Angeles, USA; Department of Neurology, University of California, Los Angeles, USA.
References
- Barbenel JC, Evan JH, Finlay JB. Stress-strain-time relations for soft connective tissues, perspectives in biomedical engineering. London: MacMillan; 1973. [Google Scholar]
- Beatty MF. Topics in finite elasticity: hyperelasticity of rubber, elastomers, and biological tissues—with examples. Appl Mech Rev. 1987;40:1699–1734. [Google Scholar]
- Bellezza AJ, Rintalan CJ, Thompson HW, Downs JC, Hart RT, Burgoyne CF. Deformation of the lamina cribrosa and anterior scleral canal wall in early experimental Glaucoma. Invest Ophthalmol Vis Sci. 2003;44(2):623–637. doi: 10.1167/iovs.01-1282. [DOI] [PubMed] [Google Scholar]
- Bilston LE, Liu Z, Phan-Thien N. Linear viscoelastic properties of bovine brain tissue in shear. Biorheology. 1998;34:377–385. doi: 10.1016/s0006-355x(98)00022-5. [DOI] [PubMed] [Google Scholar]
- Bilston LE, Liu Z, Phan-Thien N. Large strain behaviour of brain tissue in shear: some new experimental data and differential constitutive model. Biorheology. 2001;38:335–345. [PubMed] [Google Scholar]
- Bilston LE, Thibault LE. The mechanical properties of the human cervical spinal cord. Ann Biomed Eng. 1996;24:67–74. doi: 10.1007/BF02770996. [DOI] [PubMed] [Google Scholar]
- Buchtal F, Kaiser E. The rheology of the cross striated muscle fiber with particular reference to isotonic conditions. Dan Biol Med. 1951;21:328–336. [Google Scholar]
- Chang GL, Hung TK, Feng WW. An in-vivo measurement and analysis of viscoelastic properties of the spinal cord of cats. ASME J Biomech Eng. 1996;110:115–122. doi: 10.1115/1.3108415. [DOI] [PubMed] [Google Scholar]
- Chaudhry HR, Bukiet B, Findley T, Ritter AB. Evaluation of residual stress in rabbit skin and the relevant material constants. J Theor Biol. 1998;192:191–195. doi: 10.1006/jtbi.1997.0616. [DOI] [PubMed] [Google Scholar]
- Collins CC, Carlson MR, Scott AB, Jampolsky A. Extraocular muscle forces in normal human subjects. Invest Ophthalmol Vis Sci. 1981;20:652–664. [PubMed] [Google Scholar]
- De Hoff P. On the nonlinear viscoelastic behaviour of soft biological tissues. J Biomech. 1978;11:35–40. doi: 10.1016/0021-9290(78)90041-6. [DOI] [PubMed] [Google Scholar]
- Demer JL, Miller JM, Poukens V, Vinters HV, Glasgow BJ. Evidence for fibromuscular pulleys of the recti extraocular muscles. Invest Ophthalmol Vis Sci. 1995;36(6):1125–1136. [PubMed] [Google Scholar]
- Demer JL, Oh SY, Clark RA, Poukens V. Evidence for a pulley of the inferior oblique muscle. Invest Ophthalmol Vis Sci. 2003;44:3856–3865. doi: 10.1167/iovs.03-0160. [DOI] [PubMed] [Google Scholar]
- Demer JL, Poukens V, Miller JM, Micevych P. Innervation of extraocular pulley smooth muscle in monkeys and humans. Invest Ophthalmol Vis Sci. 1997;38(9):1774–1785. [PubMed] [Google Scholar]
- Downs JC, Suh JKF, Kevin AT, Anthony JB, Claude FB, Richard TH. Viscoelastic characterization of peripapillary sclera: material properties by quadrant in rabbit and monkey eyes. J Biomech Eng. 2003;125(1):124–131. doi: 10.1115/1.1536930. [DOI] [PMC free article] [PubMed] [Google Scholar]
- Downs JC, Suh JKF, Thomas KA, Bellezza AJ, Hart RT, Burgoyne CF. Viscoelastic material properties of the peripapillary sclera in normal and early-glaucoma monkey eyes. Invest Ophthalmol Vis Sci. 2005;46(2):540–546. doi: 10.1167/iovs.04-0114. [DOI] [PubMed] [Google Scholar]
- Estes JM, McElhaney JH. Response of brain tissue to compressive loading. ASME 70-BHF, 13. 1970 [Google Scholar]
- Farshad M, Barbezat M, Flueler P, Schmidlin F, Graber P, Niedere P. Material characterization of the pig kidney in relation with the biomechanical analysis of renal trauma. J Biomech. 1999;32:417–425. doi: 10.1016/s0021-9290(98)00180-8. [DOI] [PubMed] [Google Scholar]
- Fung YC. Elasticity of soft tissue in simple elongation. Am J Physiol. 1967;213:1532–1544. doi: 10.1152/ajplegacy.1967.213.6.1532. [DOI] [PubMed] [Google Scholar]
- Fung YC. Stress-strain-history relations of soft tissues in simple elongation, biomechanics: its foundations and objectives. Englewood Cliffs: Prentice-Hall; 1972. [Google Scholar]
- Fung YC. Biomechanics: mechanical properties of living tissues. New York: Springer; 1993. [Google Scholar]
- Galford JE, McElhaney JH. A visco-elastic study of scalp, brain, and dura. J Biomech. 1970;3:211–221. doi: 10.1016/0021-9290(70)90007-2. [DOI] [PubMed] [Google Scholar]
- Holenstein R, Niederer P, Anliker M. A viscoelastic model for use in predicting arterial pulse waves. ASME J Biomech Eng. 1980;102:302–318. doi: 10.1115/1.3138229. [DOI] [PubMed] [Google Scholar]
- Huyghe JH, Van Campen DH, Arts T, Heethaar RM. The constitutive behaviour of passive heart muscle tissue: a quasi-linear viscoelastic formation. J Biomech. 1991;24:841–849. doi: 10.1016/0021-9290(91)90309-b. [DOI] [PubMed] [Google Scholar]
- Jenkins RB, Little RW. Aconstitutive equation for parallel fibered elastic tissue. J Biomech. 1974:397–402. doi: 10.1016/0021-9290(74)90002-5. [DOI] [PubMed] [Google Scholar]
- Johnson GA, Livesay GA, Woo SLY, Rajagopal KR. A single integral finite strain viscoelastic model of ligaments tendons. J Biomech Eng. 1996;118:221–226. doi: 10.1115/1.2795963. [DOI] [PubMed] [Google Scholar]
- Kono R, Poukens V, Demer JL. Quantitative analysis of the structure of the human extraocular muscle pulley system. Invest Ophthalmol Vis Sci. 2002;43(9):2923–2932. [PubMed] [Google Scholar]
- Kono R, Poukens V, Demer JL. Superior oblique muscle layers in monkeys and humans. Invest Ophthalmol Vis Sci. 2005;46(8):2790–2799. doi: 10.1167/iovs.04-1147. [DOI] [PubMed] [Google Scholar]
- Lanir Y. The rheological behavior of skin: experimental results and a structural model. Biorheology. 1979;16:191–202. doi: 10.3233/bir-1979-16308. [DOI] [PubMed] [Google Scholar]
- Lin HC, Kwan MKW, Woo SLY. On the stress relaxation properties of the anterior cruciate ligament(ACL) Adv Bioeng. 1987:5–6. [Google Scholar]
- Liu Z, Bilston LE. On the viscoelastic character of liver tissues: experiments and modeling of the linear behavior. Biorheology. 2000;37:191–201. [PubMed] [Google Scholar]
- Maynewman K, McCulloch AD. Homogenization modeling for the mechanics of perfused myocardium. Prog Biophys Mol Biol. 1998;69:463–481. doi: 10.1016/s0079-6107(98)00020-0. [DOI] [PubMed] [Google Scholar]
- Mendis KK, Stalnaker RL, Roberts VL. A constitutive relation for large deformation finite element modeling of brain tissue. J Biomech Eng. 1995;117:279–285. doi: 10.1115/1.2794182. [DOI] [PubMed] [Google Scholar]
- Miller JM. Functional anatomy of normal human rectus muscles. Vis Res. 1989;29:223–240. doi: 10.1016/0042-6989(89)90126-0. [DOI] [PubMed] [Google Scholar]
- Miller JM, Demer JL, Poukens V, Pavlovski DS, Nguyen HN, Rossi EA. Extraocular connective tissue architecture. J Vis. 2003;2:12–23. doi: 10.1167/3.3.5. [DOI] [PubMed] [Google Scholar]
- Miller JM, Robins D. Extraocular muscle sideslip and orbital geometry in monkeys. Vis Res. 1987;27(3):381–392. doi: 10.1016/0042-6989(87)90087-3. [DOI] [PubMed] [Google Scholar]
- Miller K, Chinzei K. Mechanical properties of brain tissue in tension. J Biomech. 2002;35(4):483–490. doi: 10.1016/s0021-9290(01)00234-2. [DOI] [PubMed] [Google Scholar]
- Miller K, Chinzei K. Constitutive modeling of brain tissue: experiment and theory. J Biomech Eng. 1997;30:1115–1121. doi: 10.1016/s0021-9290(97)00092-4. [DOI] [PubMed] [Google Scholar]
- Nasseri S, Bilston LE, Phan-Thien N. Viscoelastic properties of pig kidney in shear, experimental results and modeling. Rheol Acta. 2002;41:180–192. [Google Scholar]
- Oh SY, Poukens V, Cohen MS, Demer JL. Structure-function correlation of laminar vascularity in human rectus extraocular muscles. Invest Ophthalmol Vis Sci. 2001;42(1):17–22. [PubMed] [Google Scholar]
- Oh SY, Poukens V, Demer JL. Quantitative analysis of rectus extraocular muscle layers in monkey and humans. Invest Ophthalmol Vis Sci. 2001;42(1):10–16. [PubMed] [Google Scholar]
- Pamidi MR, Advani SH. Nonlinear constitutive equations for human brain tissue. J Biomech Eng. 1978;100:44–48. [Google Scholar]
- Phan-Thien N, Nasseri S, Bilston LE. Oscillatory squeezing flow of a biological material. Rheol Acta. 2000;39:409–417. [Google Scholar]
- Phan-Thien N, Safari-Ardi M, Morales PA. Oscillatory and simple shear flows of a flour-water dough: a constitutive model. Rheol Acta. 1997;36:38–48. [Google Scholar]
- Pinto JG, Fung YC. Mechanical properties of heart muscle in the passive state. J Biomech. 1973;6:597–616. doi: 10.1016/0021-9290(73)90017-1. [DOI] [PubMed] [Google Scholar]
- Pinto JG, Patitucci PJ. Visco-elasticity of passive cardiac muscle. ASME J Biomech Eng. 1980;102:57–61. doi: 10.1115/1.3138199. [DOI] [PubMed] [Google Scholar]
- Pradas MM, Calleja RD. Nonlinear viscoelastic behavior of the flexor tendon of the human hand. J Biomech. 1990;23:773–781. doi: 10.1016/0021-9290(90)90024-w. [DOI] [PubMed] [Google Scholar]
- Robinson DA, O’Meara DM, Scott AB, Collins CC. Mechanical components of human eye movement. J Appl Physiol. 1969;26:548–553. doi: 10.1152/jappl.1969.26.5.548. [DOI] [PubMed] [Google Scholar]
- Schmidlin FR, Schmid P, Kurtyke T, Iselin CE, Graber P. Force transmission and stress distribution in a computer simulated model of kidney: an analysis of the injury mechanisms in renal trauma. J Trauma. 1996;40:791–796. doi: 10.1097/00005373-199605000-00019. [DOI] [PubMed] [Google Scholar]
- Schoemaker I, Hoefnagel PPW, Mastenbroek TJ, Kolff CF, Schutte S, van der Helm FCT, Picken SJ, Gerritsen AFC, Wielopolski PA, Spekreijse H, Simonsz HJ. Elasticity, viscosity, and deformation of orbital fat. Invest Ophthalmol Vis Sci. 2006;47(11):4819–4826. doi: 10.1167/iovs.05-1497. [DOI] [PubMed] [Google Scholar]
- Shoemaker PA, Schneider D, Lee MC, Fung YC. A constitutive model for two dimensional soft tissues and its application to experimental data. J Biomech. 1986;19:695–702. doi: 10.1016/0021-9290(86)90193-4. [DOI] [PubMed] [Google Scholar]
- Simonsz HJ. Force-length recording of eye muscles during local anesthesia surgery in 32 strabismus patients. Strabismus. 1994;2:197–218. doi: 10.3109/09273979409035475. [DOI] [PubMed] [Google Scholar]
- Simonsz HJ, Harting F, De Wall BJ, Verbeeten BWJM. Sideways displacement and curved path of recti eye muscles. Arch Ophthalmol. 1985;(103):124–128. doi: 10.1001/archopht.1985.01050010130036. [DOI] [PubMed] [Google Scholar]
- Treloar L. The physics of rubber elasticity. Oxford: Clarendon Press; 1975. [Google Scholar]
- Viidik A. Biomechanics and functional adaptation of tendons and joint ligaments. In: Evans FG, editor. Studies on the anatomy and function of bone and joints. New York: Springer; 1966. [Google Scholar]
- Weiss JA, Maker BN, Govindjee S. Finite element implementation of incompressible, transversely isotropic hyperelasticity. Comput Methods Appl Mech Eng. 1996;135(1–2):107–128. [Google Scholar]
- Woo SLY, Simon BR, Kuei SC, Akeson WH. Quasilinear viscoelastic properties of normal articular cartilage. J Biomech Eng. 1980;102:85–90. doi: 10.1115/1.3138220. [DOI] [PubMed] [Google Scholar]
- Yoo LH, Kim H, Gupta V, Demer JL. Quasi-linear viscoelastic behavior of bovine extra-ocular muscle tissue. Invest Ophthalmol Vis Sci, iovs. 2009;50(8):3721–3728. doi: 10.1167/iovs.08-3245. [DOI] [PMC free article] [PubMed] [Google Scholar]


