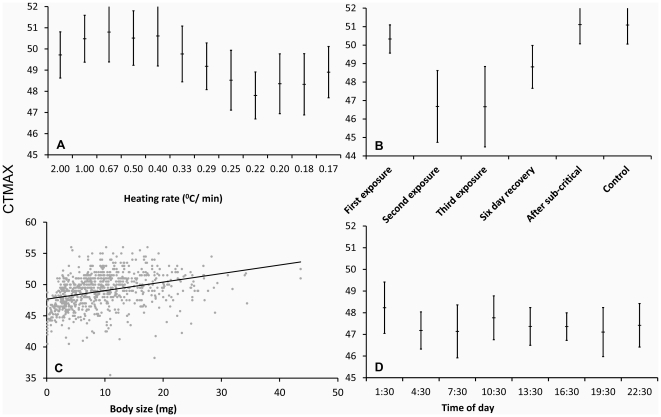
Figure 1. Results of CTMaxs tests.
a) CTMaxs measured at different heating rates from 2°C/min to 0.16°C/min. b) CTMax estimates corresponding to different contrasts: i) the contrast between the first exposure*, and second and third exposures, to determine reproducibility under short-time recovery (each exposure with a 24 h interval); ii) the contrast between the first exposure* and the six-day recovery, to determine reproducibility under long-time recovery (144 h); iii) The contrast between the first exposure* and the CTMax after subcritical exposure and the manipulation control. c) Correlation between body mass and CTMax. d) CTMax measured at different times of the day. Bars indicate SDs. *The results from the first days of the short- and long-time recovery experiments are plotted together.

