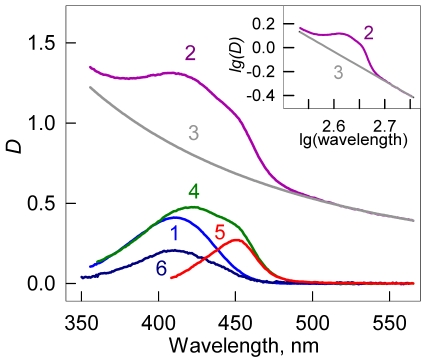
Figure 1. Absorption spectra of thioflavin T (ThT) incorporated in the amyloid fibril.
Curves 1 and 2 represent absorption spectra of ThT in chamber #1 (free ThT at concentration Cf) and in chamber #2 (superposition of the absorption spectra of free ThT in concentration Cf, ThT bound to fibril in concentration Cb, and the apparent absorption caused by the light scattering) after the equilibrium attainment. Curve 3 represents optical density determined by the fibril light scattering as calculated by the equation Dscat = aλ−m. Coefficients a and m were determined from the linear part of the curve 2 (where there is no active dye absorption) plotted in logarithmic coordinates lg(Dscat) = f(lg(λ)) (see Insert, curve 3). Curve 4 represents the total absorption of free and bound dye after light scattering subtraction (D(λ)#2−Dscat). Curve 5 is the absorption spectra of ThT incorporated in the amyloid fibril evaluated as Db(λ) = D(λ)#2−D(λ)scat−D(λ)#1 (the difference between the spectra 4 and 1). Curve 6 is the absorption spectrum of the free dye at the concentration equal to that of bound dye (D(λ)0−2D(λ)#1). This curve allows for the evaluation of the change in the molar extinction coefficient of ThT when bound to fibril. Concentration of protein that was used for amyloid fibril preparation was Cp = 6.9⋅10−5 M.

