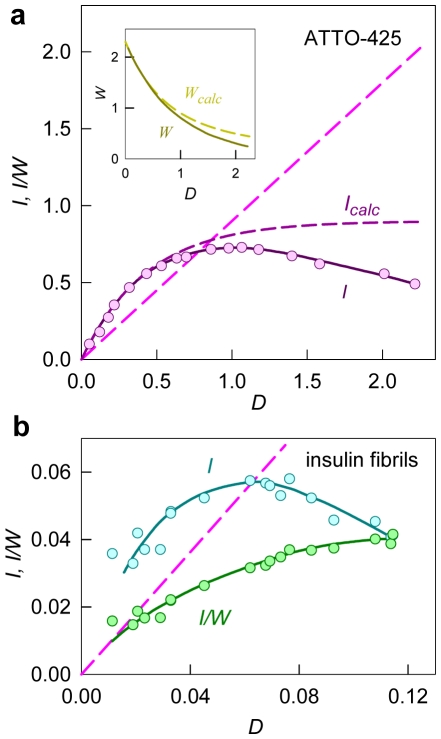
Figure 4. The dependence of fluorescence intensity on optical density of fluorophore and on total optical density of solution.
(a) The dependences of fluorescence intensity on optical density (DATTO) of the fluorescence dye ATTO-425 with known quantum yield (qATTO = 0.9) calculated from equation (15) and experimentally recorded I. The dependence of fluorescence intensity on the optical density of the fluorescent substance (I) differs from the calculated one (Icalc) because an increase in the total optical density of the solution results in the increased absorption of the excitation light by the solution layers adjacent to the front wall of the spectrofluorometer cell, while the detecting system of spectrofluorometer “see” the central part of the cell, which is reached by a respectively smaller part of the excitation light. Due to this effect, the recorded fluorescence intensity begins to diminish after optical density reaches some value. The discussed effects depend on the instrument used and must also be taken into account. This can be accomplished by replacing Wcalc with W, which depends on total optical density of the solution and can be determined experimentally. As for Wcalc, the value of W is determined only by the total optical density of solution and does not depend on the contribution of the optical density of the fluorescent substance. The dependences of Wcalc and W on total optical density are given in the Insert. The strait dashed line is the dependence of DATTOq on DATTO calculated as DATTOq = Icalc/Wcalc = I/W. (b) The dependencies of the experimentally recorded fluorescence intensity (I) and the reduced fluorescence intensity (I/W) of ThT bound to insulin fibril on its optical density (Db). The strait dashed line is the dependence of DATTOq on DATTO for the fluorescence dye ATTO-425 (etalon with qATTO = 0.9).

