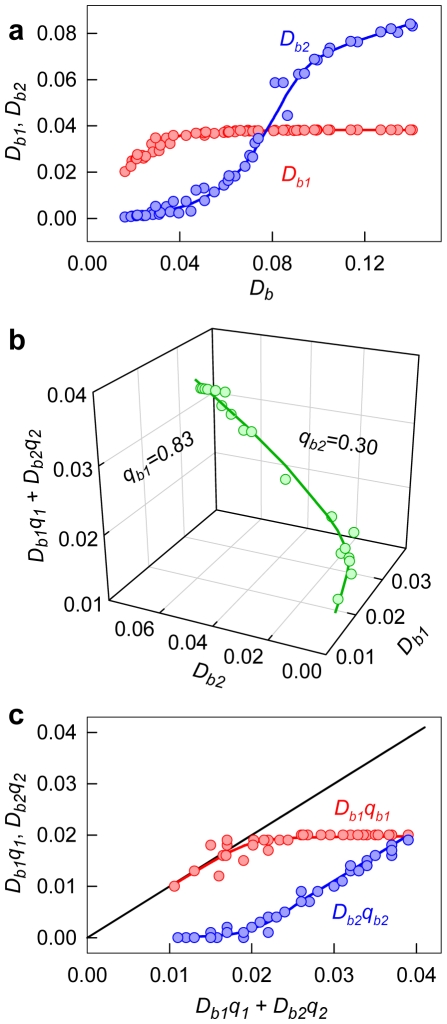
Figure 5. Determination of the fluorescence quantum yield of thioflavine T (ThT) bound to fibril.
(a) Optical density of ThT bound to amyloid fibril as superposition of optical densities of the dye bound in mode 1 (Db1) and mode 2 (Db2). (b) 3D dependence of Db1qb1+Db2qb2 from Db1 and Db2. Experimental data, best fit curve and the values of qb1 and qb2, determined multiple nonlinear regression are presented. (c) Reduced fluorescence intensities of ThT/W as superposition of the reduced fluorescence intensities of the dye bound to mode 1 (Db1qb1) and mode 2 (Db2qb2).

