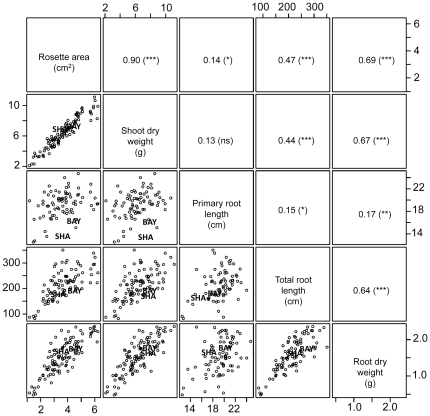
Figure 1. Correlation matrix between the different root and shoot growth variables at 24 days after sowing within the 165 individuals of the Bay-0×Shahdara RIL population.
Dots represent the mean values of each RIL (4 individuals), and Bay-0 and Shahdara parental lines are indicated. Pearson's coefficients (r) associated to correlations are shown with their p-value (***, p-value<0.001, **, p-value<0.01, *, p-value<0.05, ns, p-value>0.05). Shoot and root dry weight are expressed in mg, rosette area in cm2, total and primary root length in cm.

