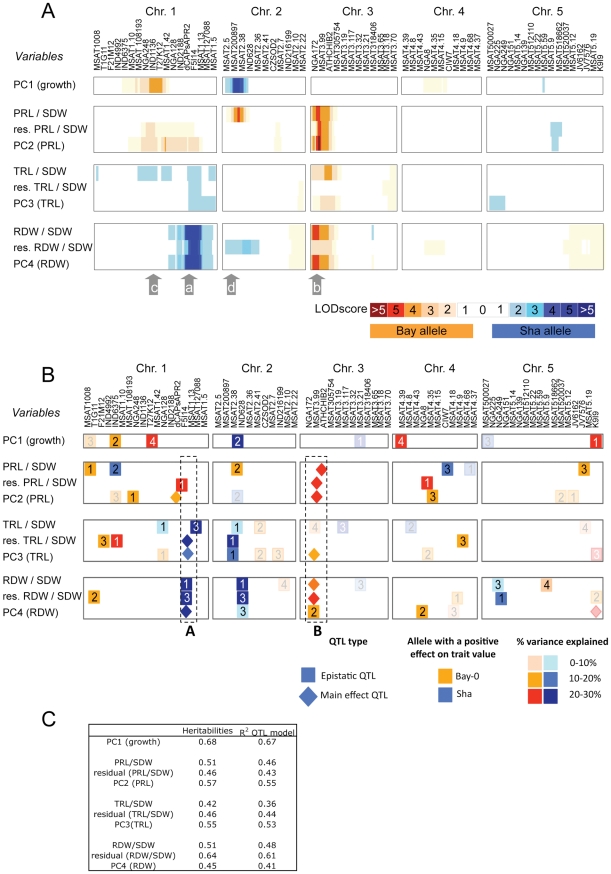
Figure 4. Genetic map of the QTLs detected for root to shoot ratio, residuals of correlations between root variables and shoot dry weight and coordinates in the principal component analysis.
A. Map of the LOD score values all along the genome using Interval Mapping analysis. A color code indicates the parental allele which increases the value of the variables at the marker (blue for Sha alleles, and red for Bay alleles). The LOD score value is shown as different color intensities. Arrows a to d refer to regions described in the text. B. Map of the regions involved in models combining main effects and epistatic QTLs. A color code indicates both the allele which increases the value of the variable at one specific region and the percentage of variance explained by the QTL. Identical numbers are indicated in the two partners of the epistatic interaction. A and B rectangles refer to regions controlling root related variable but not involved in global plant growth. Data are those obtained 24 days after sowing (the map at 20 days after sowing is shown as supplementary material). QTLs not retrieved in the map from 20 days after sowing plants are shown with a translucent color. C. Broad-sense heritability and r2 of the QTL models shown in B.

