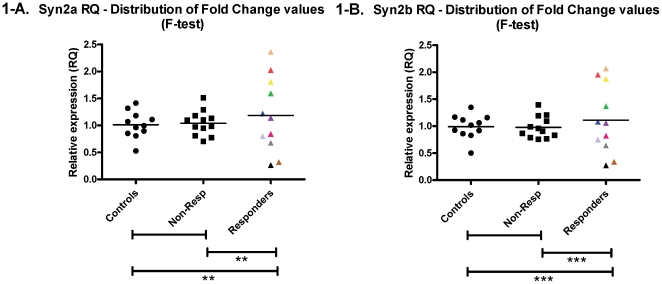
Figure 1. Lymphoblastoid cell line expression.
Relative Quantification (RQ) values from qRT-PCR relative to GAPDH as an endogenous control. The groups compared are non-psychiatric controls, bipolar disorder patients without positive response to lithium (Non-Resp) and bipolar disorder patients with excellent response to lithium. The expression analyses were performed with separate primer sets for SYN2a (left) and SYN2b (right). The asterisks refer to F-test p-values depicting the differences in distribution between the individual expression changes in each group (** p-value≤0.001; *** value≤0.0001). There were no significant mean group differences, as indicated in Table 2.

