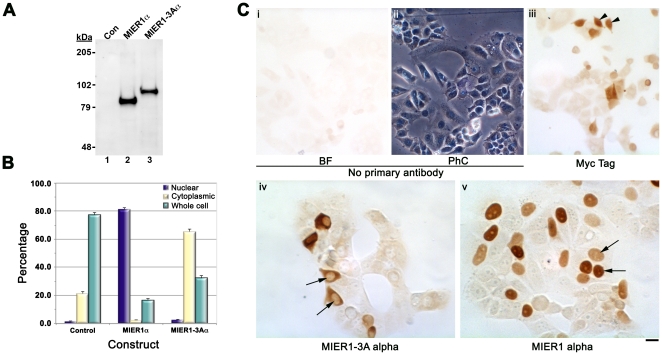
Figure 2. Subcellular localization of the MIER1α and MIER1-3Aα isoforms in MCF7 cells.
MCF7 cells were transfected with myc-tagged MIER1α, MIER1-3Aα or empty vector and analyzed by immunocytochemistry or immunoblotting with the 9E10 monoclonal antibody. (A) Western blot of extracts from MCF7 cells transfected with empty vector (lane 1), myc-tagged mier1α (lane 2) or myc-tagged mier1-3Aα (lane 3); staining was performed with the 9E10 antibody and confirms that a single protein in each cell extract is recognized by the antibody. The positions of the molecular weight standards are indicated on the left. (B) Histogram showing the results of 3 experiments; random fields were selected and the staining pattern of each cell within the field was scored visually according to the categories described in the Results & Discussion. 650–1,350 cells were scored for each construct. Plotted is the percentage of cells in each category ± S.D. (C) Illustrative examples of the observed staining pattern. Panels (i) & (ii) show brightfield (BF) and the corresponding phase contrast (PhC) views of a staining control, prepared without primary antibody. Panel (iii) shows cells expressing the myc-tag alone; examples of whole cell staining are indicated by arrowheads. Panels (iv) & (v) show cells expressing MIER1-3Aα & MIER1α, respectively; note the absence of nuclear staining in panel (iv) while nuclei in panel (v) are intensely stained (arrows). Scale bar = 50 µm for (i)–(iii) and 25 µm for (iv)–(v).

