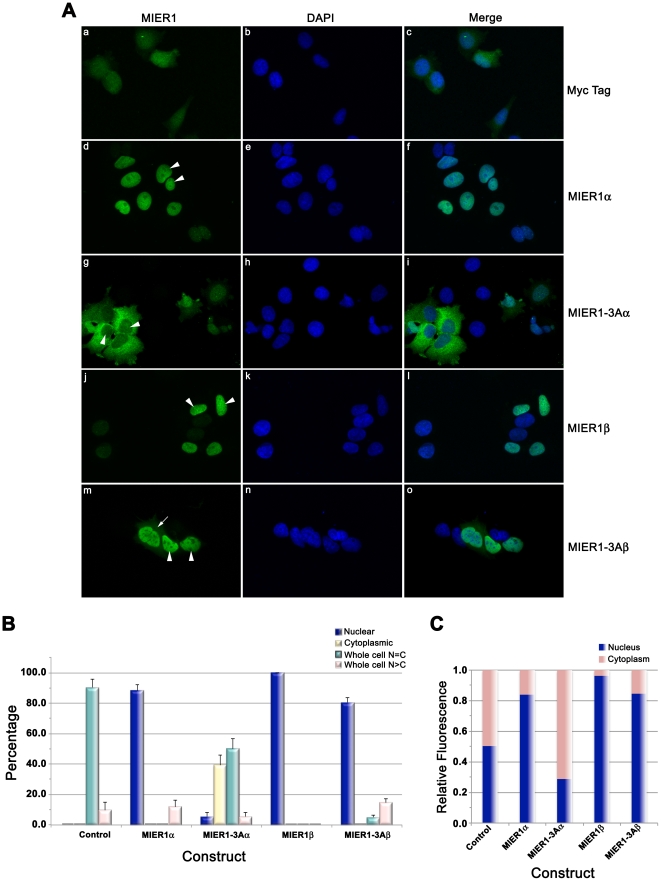
Figure 4. Subcellular localization of the MIER1-3Aβ isoform in MCF7.
MCF7 cells were transfected with myc-tagged MIER1α, MIER1-3Aα, MIER1β, MIER1-3Aβ or empty vector and analyzed by confocal microscopy, performed as in the legend to Fig. 3. (A) Illustrative examples of cells expressing myc-tag alone (a–c), MIER1α (d–f), MIER1-3Aα (g–i), MIER1β (j–l) or MIER1-3Aβ (m–o). Arrowheads indicate nuclei and the arrow indicates staining in the cytoplasm. (B) Histogram showing the results of 4 independent experiments; the staining pattern was scored as in the legend to Fig. 3. Plotted is the percentage of cells in each category ± S.D; 55–160 cells were scored for each construct. Note that, unlike MIER1-3Aα, MIER1-3Aβ remains predominantly nuclear. (C) Bar graph showing the intracellular distribution of each construct. Pixel values for the nuclear and in the cytoplasmic areas were measured using Image J v1.46 and plotted as a proportion of the total signal. Shown is the proportion in each compartment, using measurements from 30–40 cells for each construct.

