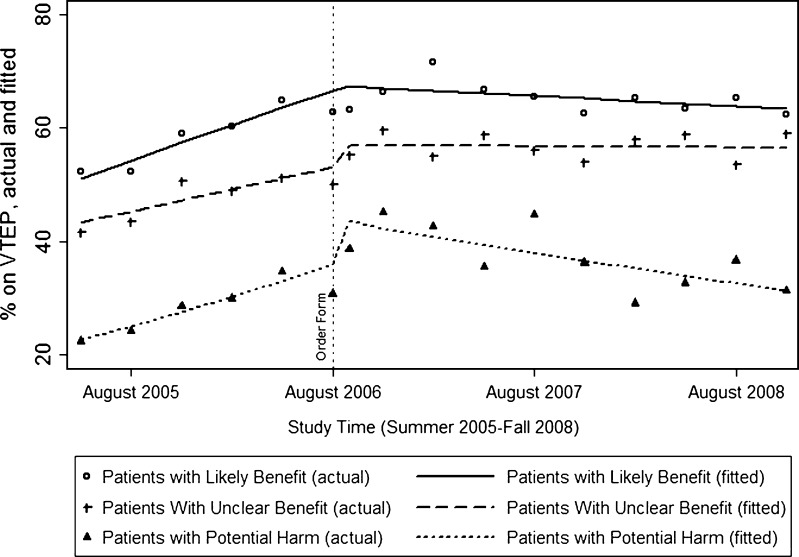
Figure 1.
Patients receiving venous thromboembolism prophylaxis, by subgroup. Lines indicate fitted rates in each group per quarter (solid, dashed, and dotted lines indicating patients with likely benefit, unclear benefit, and potential harm, respectively), assuming a linear trend prior to the intervention, a change at the moment of the intervention, and a linear trend following the intervention, adjusted for age, sex, race, ethnicity, admitting service, admission source, insurance, and Elixhauser comorbidity measures. The scatter plots indicate actual means per quarter (hollow circles, pluses, and solid triangles indicating patients with likely benefit, unclear benefit, and potential harm, respectively).

