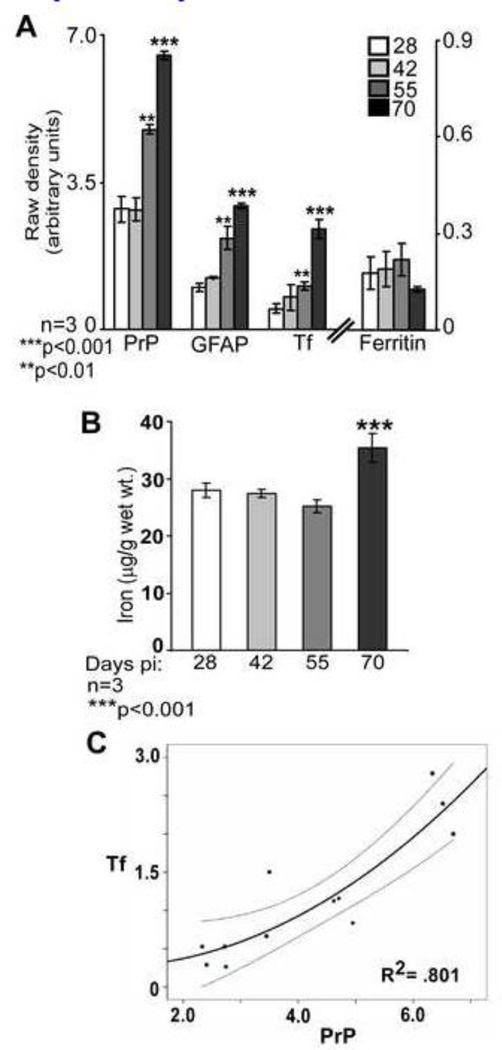
Figure 4. PrP and Tf show a direct correlation during disease progression.
(A) Quantification by densitometry following normalization with actin shows a significant increase in PrP, GFAP, and Tf at 55 and 70 days pi relative to the 28 day sample. Ferritin levels do not show a significant change during disease progression. n=3. **p<0.01, ***p<0.001. (B) Estimation of iron shows a significant increase at 70 days pi. n=3. ***p<0.001. (C) Linear regression of Tf and PrP shows a significant correlation during disease progression. R2=.801. n=3.

