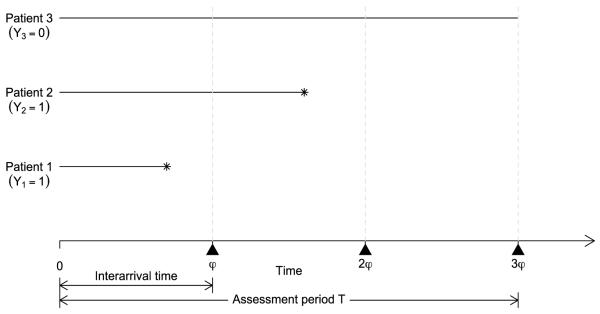
Figure 1.
Illustration of missing toxicity outcomes. For each patient, the horizontal line segment represents the follow up, at the end of which toxicity is indicated by asterisk. At time φ, the toxicity outcomes of patients 2 and 3 are missing (i.e., Y1 = 1, but Y2 and Y3 are missing); at time 2φ, the toxicity outcome of patient 3 is missing (i.e., Y1 = Y2 = 1, but Y3 is missing); and at time 3φ, Y1 = Y2 = 1, and Y3 = 0.

