
Figure 3.
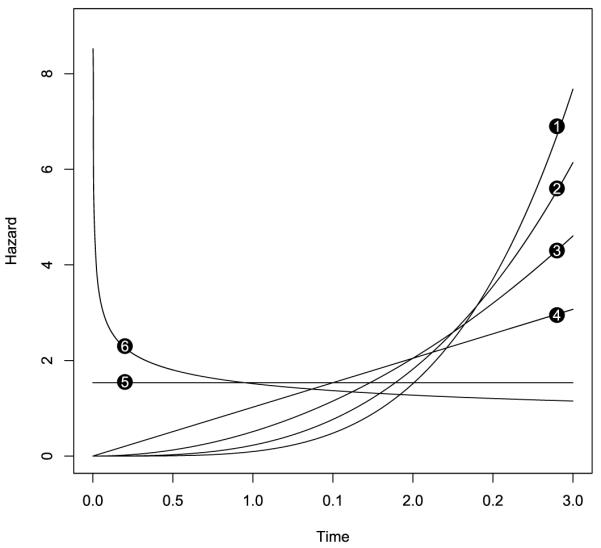
Hazards of the time to toxicity at different dose levels in the sensitivity analysis. The number attached to each hazard curve represents the corresponding dose level.
Official websites use .gov
A
.gov website belongs to an official
government organization in the United States.
Secure .gov websites use HTTPS
A lock (
) or https:// means you've safely
connected to the .gov website. Share sensitive
information only on official, secure websites.
Hazards of the time to toxicity at different dose levels in the sensitivity analysis. The number attached to each hazard curve represents the corresponding dose level.