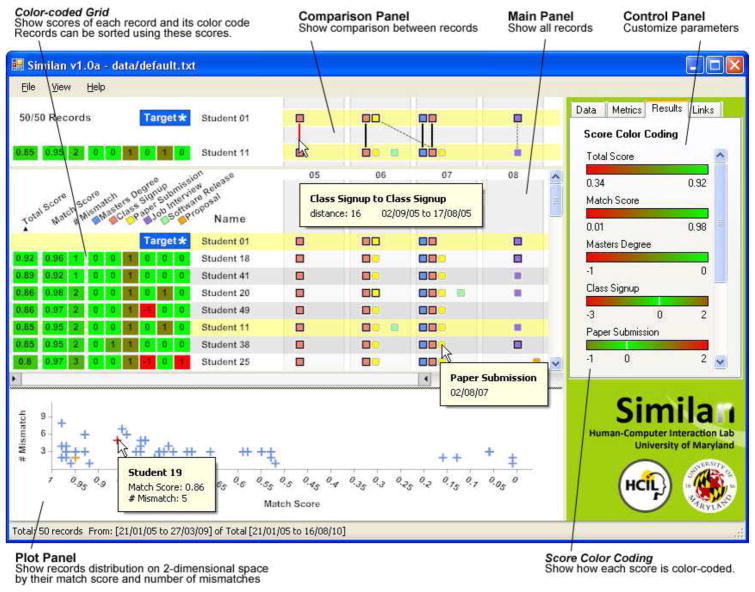
Figure 2.
A screenshot of Similan, the predecessor of Similan2. Users can start by double-clicking to select a target record from the main panel. Similan will calculate a score that indicates how similar to the target record each record is and show scores in the color-coded grid on the left. The score color-coding bars on the right show how the scores are color-coded. The users then can sort the records according to these scores. The main panel also allows users to visually compare a target with a set of records. The timeline is binned (by year, in this screenshot). If the users want to make a more detailed comparison, they can click on a record to show the relationship between that record and the target record in the comparison panel on the top. The plot panel at the bottom shows the distribution of records. In this example, the user is searching for students who are similar to Student 01. The user sets Student 01 as the target and sorts all records by total score. Student 18 has the highest total score of 0.92 so this suggests that Student 18 is the most similar student. Student 41 and Student 18 both have one missing paper submission but Student 41 has a lower match score so Student 18 has higher total score.

