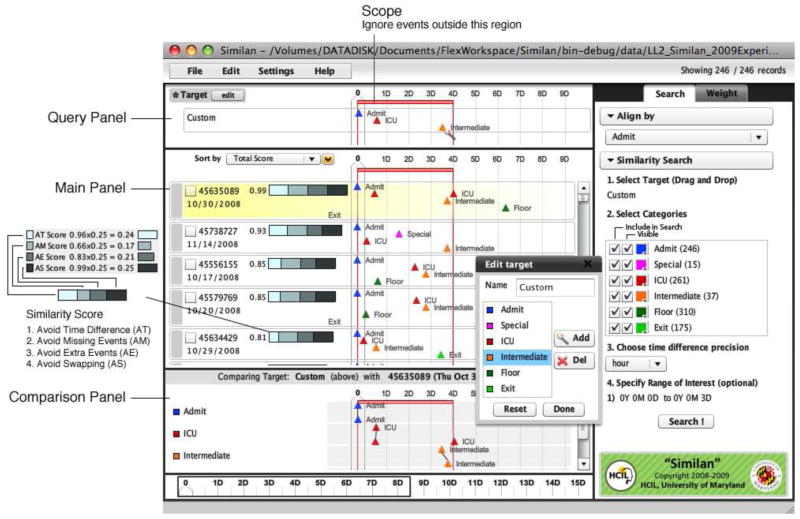
Figure 3.
Similarity search interface (Similan2) with the same query as in Figure 1. Users specify the query by placing events on the query panel. To set the time range of interest and focus on events within this range, users draw a red box. After clicking on “Search”, all records are sorted by their similarity to the query. The similarity score is represented by a number that is the total score and a bar with four sections. A longer bar means a higher similarity score. Each section of the rectangle corresponds to one decision criterion, e.g. the top two records has longer leftmost section than the third record because it has lower time difference so the Avoid Time Difference Score (AT) is high, resulting in longer bars. Figure 4 shows how users can adjust the weight.

