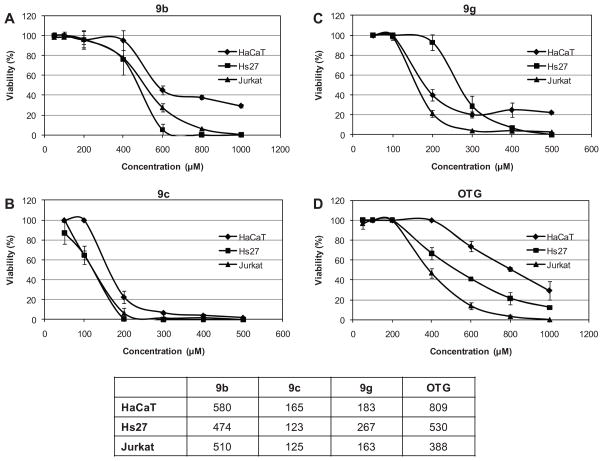
Figure 6. Dose-response curves and determination of CC50 values utilizing the MTS assay.
Dose-response effect and CC50 were determined in HaCaT, Hs27 and Jurkat cells for alkyl β-D-xylopyranosides 9b (A), 9c (B), 9g (C) and octylthioglucoside (OTG) (D). Cells were exposed for 20 h to increasing concentrations of 9b, 9c, 9g or OTG. The cellular viability is shown in the y axis while the concentration of compounds (μM) is shown in the x axis. Data are represented as the mean percentage of viable cells at each dose ± SD of four replicates. CC50 values of the experimental compounds for each cell line are summarized in (E).

