
Figure 2. Continuous relationships between BMI and risk of death at 1 year and at 5 years conditional on 1-year survival after lung transplantation.
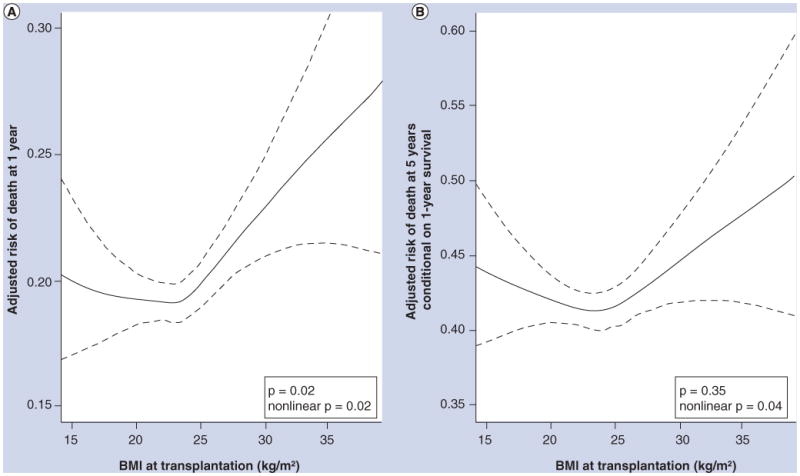
Solid lines = multivariable-adjusted smoothed regression lines. Dotted lines = 95% CI. In (A), both nonlinear (p = 0.02) and linear (p = 0.02) relationships were statistically significant. In (B), the nonlinear (p = 0.04), but not the linear (p = 0.35), relationship was statistically significant. The significant p-values for the smoothed (nonlinear) curves suggest that the relationship between BMI and risk of death after lung transplantation is nonlinear, with higher early and late mortality rates for both underweight and obese recipients. The wide confidence intervals at the extremes of BMI are due to smaller numbers of transplant recipients with these values.
Reprinted from [52] with permission of the American Thoracic Society. © American Thoracic Society.