
Figure 3. Continuous association between BMI and grade 3 primary graft dysfunction adjusted for diagnosis, cardiopulmonary bypass and transplant procedure type.
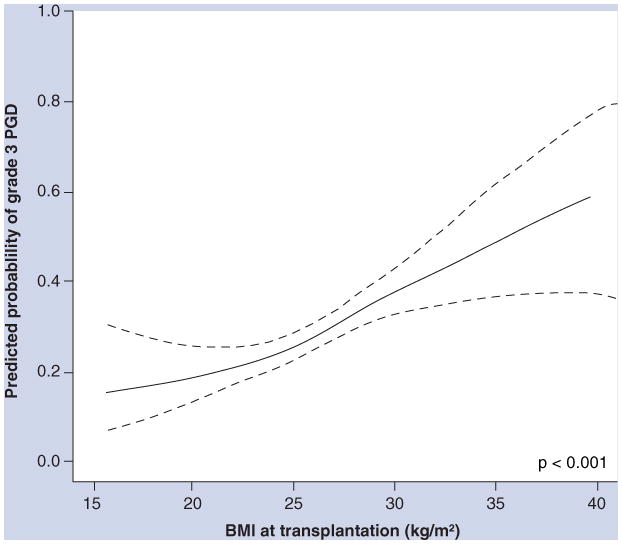
Solid line shows the effect estimate; dotted lines show the 95% CI bands. The p-value is for the association between BMI and PGD.
PGD: Primary graft dysfunction.
Reprinted from [53] with permission of the American Thoracic Society. © American Thoracic Society.