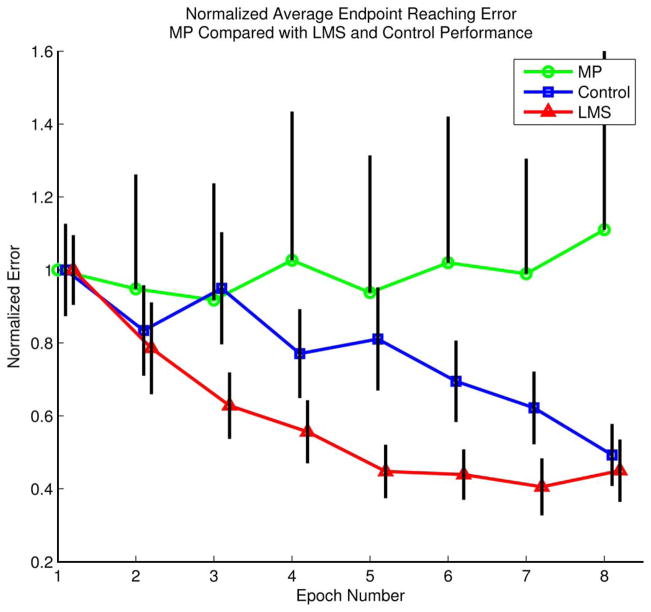
Fig. 10.
Endpoint error for MP subjects shows their lack of improvement. Black error bars are 95% confidence on the data. For clarity, only one side of the confidence interval is shown for the MP group. MP subjects are circles, control subjects are squares, and LMS subjects are triangles. Control and LMS data are reproduced from Fig. 3.

