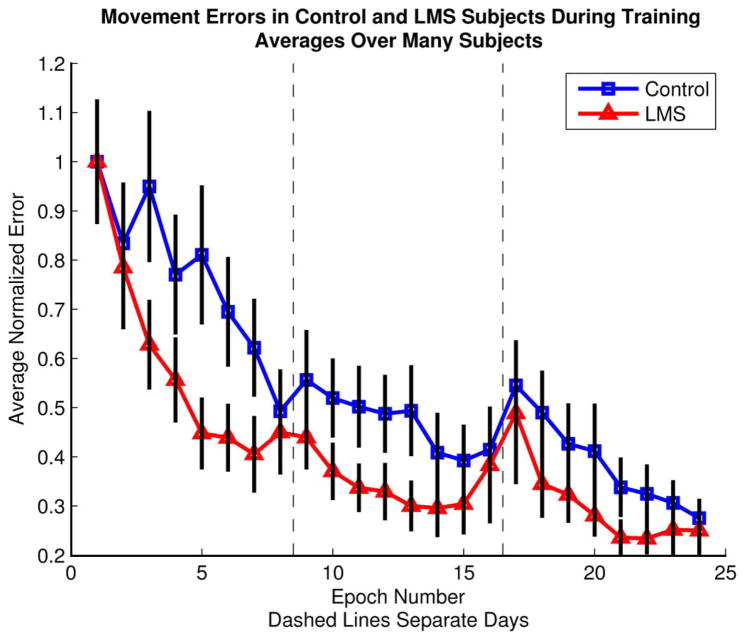
Fig. 4.
Average endpoint error approaches 30% of the initial error and the LMS group reaches this level of performance faster than the control group. Squares refer to control subjects and triangles to LMS subjects. Dashed vertical lines indicate daylong breaks from one epoch to the next. Black bars represent 95% confidence intervals.

