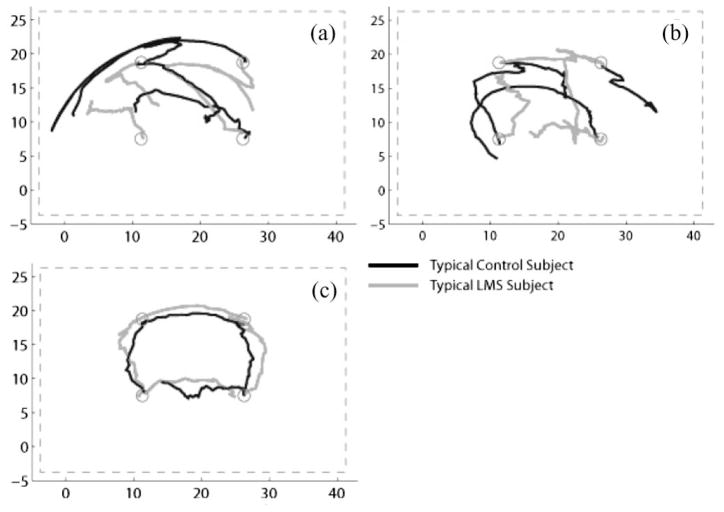
Fig. 6.
Representative trajectories across training. Each panel shows four cursor paths of a typical LMS subject (light) and four paths of a control subject (dark). In panel a, movements are taken from epoch 1, prior to training. In panel b, movements are taken from epoch 6, during training. In panel c, movements are taken from epoch 24, after training. Dashed lines represent the border of the visible workspace, and units are in centimeters.

