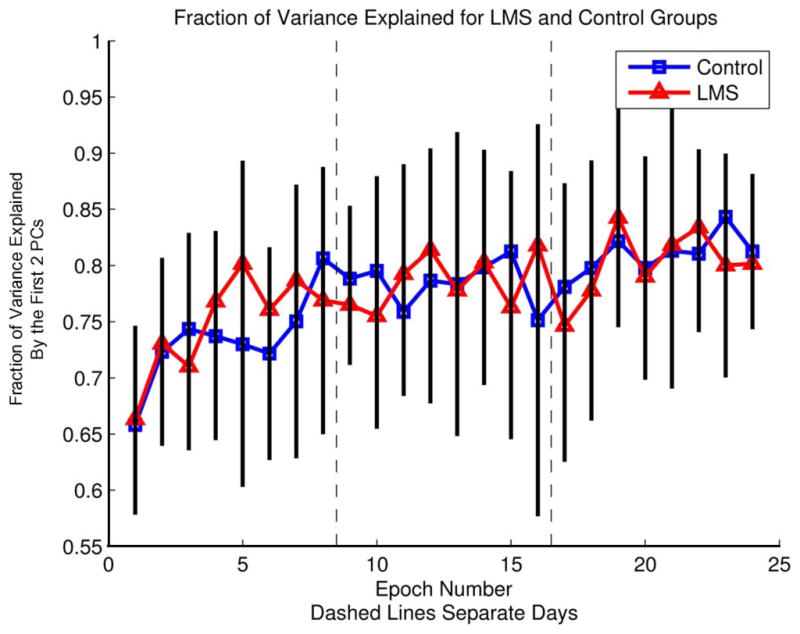
Fig. 9.

Contribution of the two highest principal components to the fraction of total variance in the data. Data were averaged across subjects in each group. The data set contains the variance of all of the subject’s hand postures once they reached their target. Squares are the control group and triangles are the LMS group. Black bars represent 95% confidence intervals.
