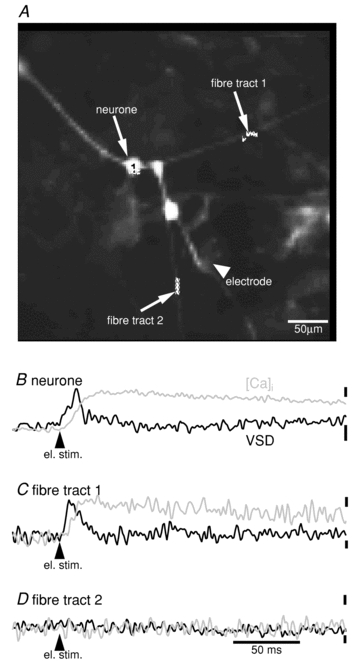
Figure 2. Recording of single soma and axon action potentials with fast calcium imaging.

A, image of cultured ENS neurones acquired with a high-speed camera with a resolution of 80 × 80 pixels. Signals from the indicated regions are shown below. Traces for change in membrane potential (black traces) and [Ca2+]i (grey traces) were obtained in separate, consecutive measurements. B, the response of the neurone shown in A was evoked by electrical stimulation of nerve fibres (location of electrode also shown in A). The action potential is accompanied by a single [Ca2+]i peak. C, action potentials recorded on a nerve fibre. D, another fibre tract showed no response to electrical stimulation suggesting that the action potential did not invade this particular nerve trunk. Scale bar for the time in D applies to all traces. Scale bars to the right side of the traces show signal amplitude of [Ca2+]i signals (top bars, ΔF/F = 2%) and voltage-sensitive dye signals (ΔF/F = 1%).
