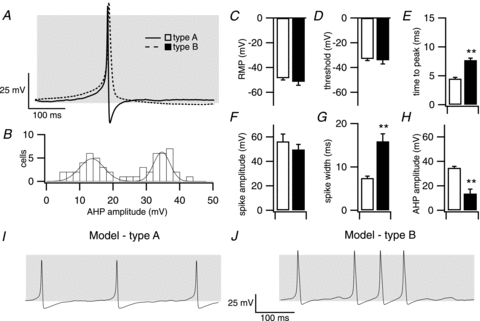
Figure 3. Characterisation of type A and type B action potentials.

Several features of type A and type B action potential waveforms differed concurrently between cells. A, averaged traces from type A (continuous line, open square) and type B (dashed line, filled square) action potentials as in Fig. 2. B, histogram of afterhyperpolarisation (AHP) amplitude from single spikes demonstrates a bimodal distribution. Spikes with an AHP amplitude >25 mV were defined as type A spikes. C–H, mean resting membrane potential (C), threshold for action potential generation (D), time to action potential peak (E), spike amplitude (F), spike width (G) and afterhyperpolarisation amplitude (H) for type A and B spikes. I and J, modelling of type A (I) and type B (J) action potentials using a revised formulation of a corticotroph action potential model that incorporates additional conductances identified in this study. Grey shading indicates membrane potential between −50 and +10 mV. Data are means ± SEM, n = 19 per group. **P < 0.01, ANOVA with post hoc Dunnett's test compared to type A spikes.
