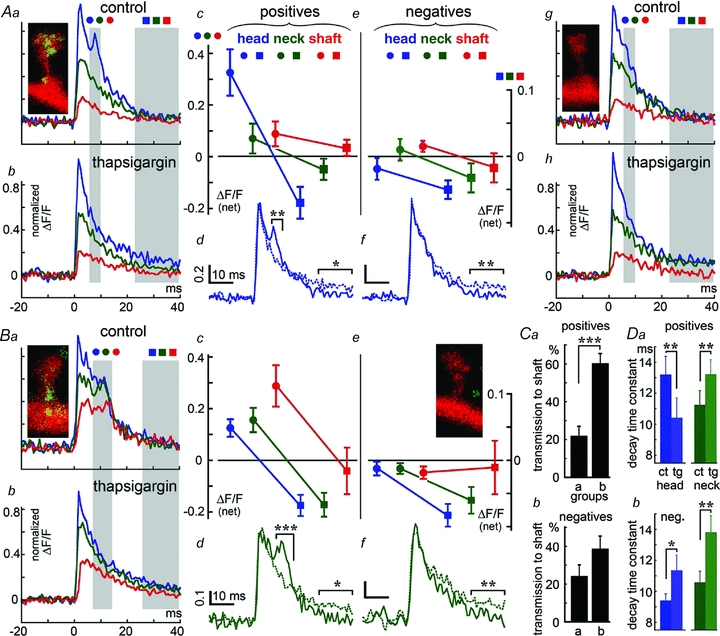
Figure 3. Location of the SP puncta is correlated with the size of the additional calcium response (‘hump’) in association with release of calcium from stores.

A, comparison between SP+ (Aa–d) (n = 9) and SP− (Ae–h) (n = 9) spines. Spines are of the same size in both groups, except that the first one contains SP puncta in or near their heads. Aa is an average of the calcium transient seen after flash photolysis of caged calcium in the spine heads of the group. The three traces represent the three compartments: spine head (blue), neck (green) and shaft (red). The shaded area is the ROI where analysis was conducted. Ab, same spines as in Aa, after exposure to thapsigargin, which smoothes the decay of the calcium transient. Ac, analysis of the net size of the calcium transient before and after thapsigargin at early stage of response (first ROI, circles) and the later stage (second ROI, squares), showing that only the spine head calcium compartment is drastically reduced by the drug (scale ΔF/F (net) in all). Ad, spine head calcium shown alone, before and after exposure to thapsigargin; Ae–h, same as Aa–d, except in SP− spines (n = 9). No ‘hump’ is found, and no effect of thapsigargin is seen during the initial stage (first ROI, circles) but becoming evident at the second stage (second ROI, squares). B, same as in A; analysis of 17 slightly shorter spines (by 0.2 μm on average), with SP puncta localized in the spine neck (Ba–d) or spines of similar dimensions, lacking SP (Be–h, n = 17). There are two clear distinctions between the spines in A and B: first, the response in the parent dendrites is far larger in B than in A, and second, the secondary rise in [Ca2+]i (the ‘hump’) is slower in B than in A, while it is seen in all 3 compartments, the head, the neck and the dendrite (Bc, circles, and Bd, neck). The late effect of thapsigargin is seen both in the heads and the necks in SP+ as well as SP− spines (Bc and Be, squares; and Bd and Bf, dots versus continuous lines). In either case, thapsigargin reduced the secondary [Ca2+]i surge in both the spine head and the parent dendrite. No such change was seen in any of the 17 control spines lacking SP (Be–h). C, the ratio between [Ca2+]i changes in the parent dendrite and the spine head was calculated for groups of nine spines matched for their length. Comparisons were made between spines containing SP in their heads (group a) and those containing SP in their necks (group b). There was a significantly larger response in the parent dendrites of the latter group compared to the former group, and compared to spines at same length and neck parameters as in groups a and b, not containing SP (Cb). Ordinate, transmission ration to the parent dendrite, as in Fig. 1F. D, analysis of decay time constants for the SP+ (Da) and SP− spines (Db), in control, left (ct, darker bars) and after exposure to thapsigargin, right (tg, lighter bars), in the heads and necks of 34 SP+ and 72 SP− longer (not stubby) spines. The decay time of only the SP+ spine heads is significantly reduced by the drug, whereas in the SP− as well as the spine necks of the SP+ spines, the drug slows down the decay time constant significantly. Ad, Af, Bd and Bf express control conditions versus thapsigargin treatment as continuous versus dashed lines.
