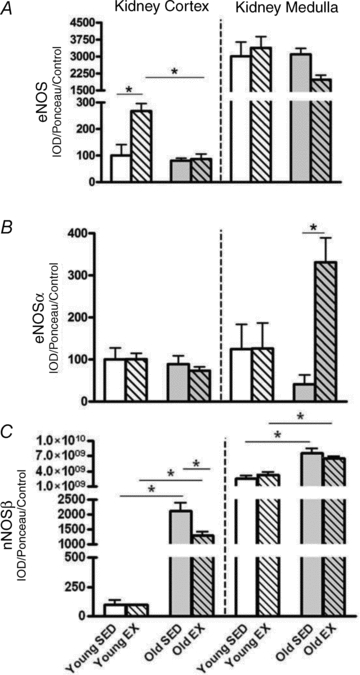
Figure 2. Protein levels of the nitric oxide synthase (NOS) enzymes in the kidney cortex and kidney medulla.

Total homogenates of kidney cortex and kidney medulla from exercise (EX) trained and sedentary (SED) rats were run using Western blot and probed for endothelial nitric oxide synthase (eNOS) (A), neuronal NOS isoform α (nNOSα) (B), and nNOS isoform β (nNOSβ) (C). Relative density units were expressed as a percentage with respect to Young SED controls of the kidney cortex. *Denotes a statistical significance of P < 0.05 between the two groups.
