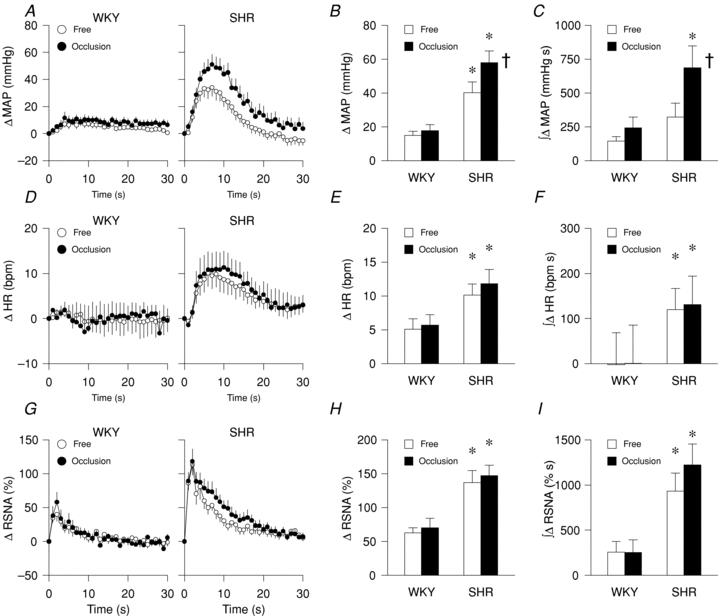
Figure 2. MAP, HR and RSNA responses to static muscle contraction during freely perfused (free) and ischaemic (occlusion) conditions in WKY and SHR.

A–C, MAP: time course (A), peak (B) and integrated (C). D–F, HR: time course (D), peak (E) and integrated (F). G–I, RSNA: time course (G), peak (H) and integrated (I). WKY: n = 13, SHR: n = 16; *P < 0.05 compared to WKY; †P < 0.05 compared to freely perfused condition.
