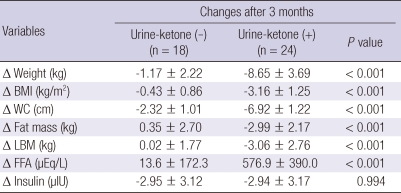
Table 2.
Comparison of anthropometric changes between ketonuria group and non-ketonuria group after 3 months of an obesity control program application
All values were mean ± standard deviation. P values was calculated by independent t test. Ketone (-), ketone (-) at initial urine test and ketone (-) at retest 1 week later; Ketone (+), ketone (-) at initial urine test and ketone (+) at retest 1 week later. BMI, body mass index; LBM, lean body mass; FFA, free fatty acid.

