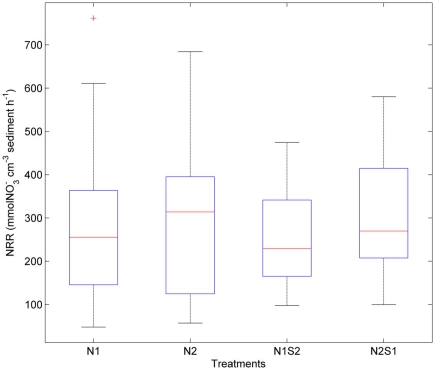
Figure 3.
Box plots of nitrate reduction rates (NRR) across all sites for the nitrate only treatments (N1 if nitrate first, N2 if sulfate first) and nitrate + sulfate treatments (N1S2 if nitrate first, N2S1 if sulfate first). Boxes encompass the upper and lower quartiles, while the line indicates the median. Asterisks are outliers.

