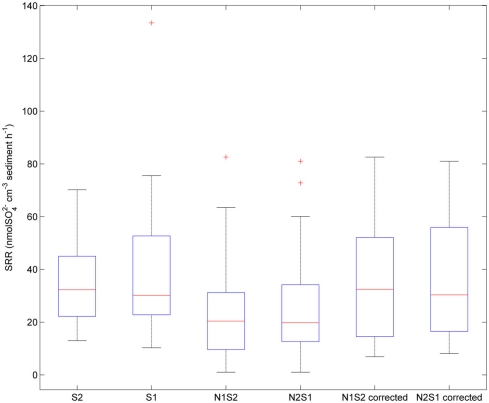
Figure 4.
Box plot of sulfate reduction rates (SRR) across all sites for the sulfate only treatments (S1 if sulfate first, S2 if nitrate first), and sulfide oxidation uncorrected and corrected SRR for nitrate + sulfate treatments (N1S2 if nitrate first, N2S1 if sulfate first). Boxes encompass the upper and lower quartiles, while the line indicates the median. Asterisks are outliers.

