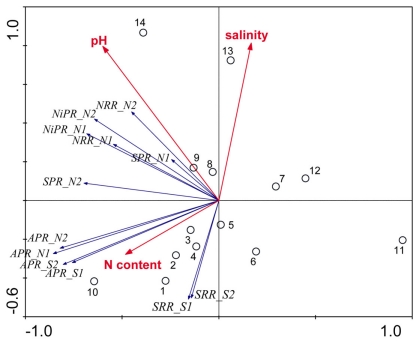
Figure 6.
Ordination triplots of first two axes (RDA1 and RDA2) generated from redundancy analysis using reaction rates (NRR, SRR, APR, NiPR, and SPR) measured when only one electron acceptor was added (treatments N and S). Response variables (red vectors) include the combination of response variables (NRR and SRR). Explanatory variables (blue vectors) entered into the models were selected stepwise by Monte Carlo permutation test. Site numbers are located according to their ordination sample scores. Transform: response variable via log 10 (x + 1), and explanatory variables via square root. Vectors pointing in the same direction indicate a positive correlation, vectors crossing at right angles indicate a near zero correlation, while vectors pointing in opposite direction show a high negative correlation.

