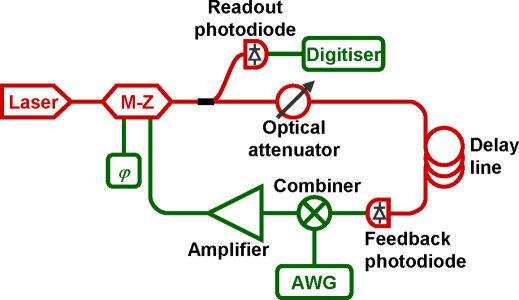
Figure 1. Schematic of the experimental set-up.
The red and green parts represent respectively the optical and electronic components. The optical part of the setup is fiber based, and operates around 1550 nm (standard telecommunication wavelength). “M-Z”: Lithium Niobate Mach-Zehnder modulator. “ϕ”: DC voltage determining the operating point of the M-Z modulator. “Combiner” : electronic coupler adding the feedback and input signals. “AWG”: arbitrary waveform generator. A computer generates the input signal for a task and feeds it into the system using the arbitrary waveform generator. The response of the system is recorded by a digitiser and retrieved by the computer which optimizes the read-out function in a post processing stage. The feedback gain α is adjusted by changing the average intensity inside the loop with the optical attenuator. The input gain β is adjusted by changing the output voltage of the function generator by a multiplicative factor. The bias ϕ is adjusted by using a DC voltage to change the operating point of the M-Z modulator. The operation of the system is fully automated and controlled by a computer using MATLAB scripts.

