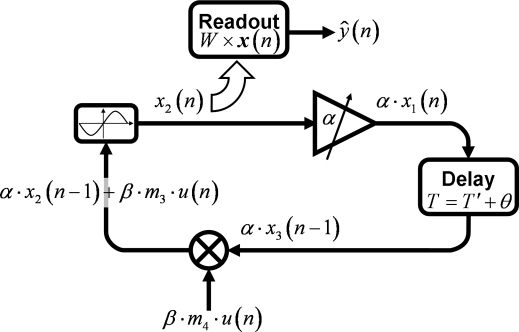
Figure 2. Schematic diagram of the information flow in the experiment depicted in Fig. 1.
On the plot we have represented four reservoir nodes at different stages of processing, labeled according to equation 5 with k = 1. Starting from the bottom, and going clockwise, a input value u(n) gets multiplied by an input gain β and a mask value mi, then mixed with the previous node state αxi−k(n − 1). The result goes through the sine function to give the new state of the reservoir xi(n), which then gets amplified by a factor α and, after the delay, will get mixed with a new input u(n + 1). All the network states xi(n) are also collected by the readout unit, multiplied by their respective weights Wi and added together to give the desired output ŷ(n).

