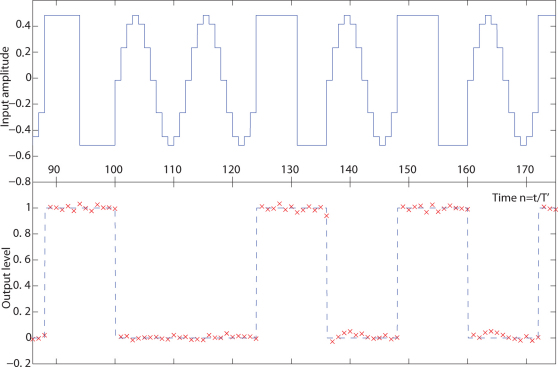
Figure 3. Signal classification task.
The aim is to differentiate between square and sine waves. The top panel shows the input u(t), a stepwise constant function resulting from the discretization of successive step and sine functions. The bottom panel shows in red crosses the output of the reservoir ŷ (n). The target function (dashed line in the lower panel) is equal to 1 when the input signal is a step function and to 0 when the input signal is a sine function. The Normalized Mean Square Error, evaluated over 1000 inputs, is  .
.

